Download
1 / 49
490 likes | 606 Vues
Archived ITS Data A New Resource for Operations, Planning and Research. Robert L. Bertini Portland State University. Introduction. “Data are too valuable to use only once.”. ADUS Is Born. ITS technologies collect data Real time control Incident management Traffic signal systems

E N D
Archived ITS DataA New Resource for Operations, Planning and Research Robert L. Bertini Portland State University
Introduction “Data are too valuable to use only once.”
ADUS Is Born • ITS technologies collect data • Real time control • Incident management • Traffic signal systems • Traveler information • Also useful if saved and accessible • Data already being collected—incentive for storing them for future use. • Difficulty not in collecting data but in gaining access to that data • US DOT Archived Data User Service (ADUS) • Managing ITS data beyond ITS • Careful management of data for various stakeholders
Who Can Use ITS Data? • Fourteen Stakeholders Identified • Transportation planning • Transportation system monitoring • Air quality analysis • MPO/state freight and intermodal planning • Land use/growth management planning • Transportation administrators and policy analysis • Traffic management • Transit management • Construction and maintenance • Safety planning and administration • CVO • Emergency management • Transportation research • Private sector
Data Poor to Data Rich Performance Monitoring • National reporting • Performance-based planning • Evaluations • Public Reactions Long Range Planning • TRANSIMS • IDAS • Four step models • Transit routes Operations Planning • Incident management • ER deployment • Signal timing • Transit service Travel Time Forecasting • Customized route planning • ATIS Advisories Other Stakeholder Functions • Safety • Land use • Air quality • Maintenance management Traffic surveillance Fare/toll systems Incident management Traffic video Environmental CVO Traffic control Highway/rail Emergency response ITS Data Archives
ADUS • Development and evaluation of operations strategies • Detailed data from ADUS • Performance monitoring • Continuous and direct measurements of actual conditions • Advanced operation products • Sophistication leads to more data requirements • Short term traffic prediction • Customized route planning • Next generation of planning and operations models • Require more detailed information
ADUS • ITS produce continuous data • Continuous data allows measurement of reliability • Reliability is key to management of transportation system • Use of ITS data requires creativity • Requires data to be stored and made accessible
ADUS Management of the transportation system cannot be done without knowledge of its performance
ADUS • Early involvement of stakeholders • Design ADUS as original function of ITS deployment • Build ADUS into ITS from the start • National ITS Architecture • Few operational examples • Consider the following set of questions….
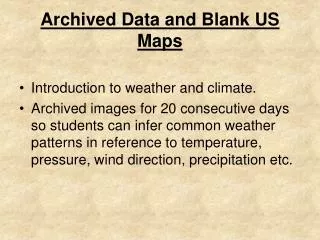
Archive Creation • Question: What data are to be stored? • Raw data • Summary statistics • Examples • Volume and lane occupancy, or • Estimated speed Credit: M. Hallenbeck, Washington DOT
Archive Creation • How much data gets stored? • All raw data • Only summary statistics • Something in between (e.g., aggregated data) • Samples of the data (raw or summary statistics) • All variables, or only some (tag IDs)
Archive Creation • At what level of aggregation • Lowest level collected • Individual vehicle passages (controller) • 20 second intervals • 5 minute intervals • 15 minute intervals • Higher • More than one level
Archive Creation • Issues that impact decision: • What use is planned for the data? • How large is storage requirement? • Cost/speed of processing raw data to more useful form • How much additional data is needed to convert the “raw” data into useful information? • Privacy concerns?
Archive Creation • Example: Tag Observations • Raw data: tag ID, location, time and date • Store all of the above? • Store O/D pairs? • Travel times? • Privacy of tag ID? • Speeds? (distance between readers)
Archive Creation • Example: Fleet AVL Information • Raw data: Vehicle ID, location, time, and date • ID may not describe route and run • Need schedule information, operations info. • Relationships change every day • Routes can change every schedule change, need historical information
Archive Creation • How and why is aggregation performed? • Quality control • Assumptions made • Details lost • Costs and benefits uncertain
Quality Control • Not all collected data is valid • Can the archive identify bad or questionable data? • How are these judgments indicated? • How/are users informed of these conditions? • How are “bad” data identified? • Sensor output • Checks against historical data • Checks against expected ranges • Other comparisons
Quality Control • What do you do with “questionable” data? • Construction • Weather • Major incidents • What resources are needed to investigate “questionable” data? • Does this affect willingness to share data? • How do you handle missing/bad data? • Does this change if you are • Storing raw data • Only storing summary data • Storing both
User Access • Who gets access to the data? • Classes of users and permission process • How do users get access to the data? • How do you communicate • What data (variables) are available • What geographic locations are available • What quality issues exist • How the data can (should) and can not (should not) be used
User Access • Meta Data • Data about data (self describing) • Truth-in-Data • The principal that says you will be honest with users about • What data are real • What data are interpolated • What data are missing and have/have not been replaced, and how those data were replaced
User Access • Do you trust users to use data correctly? • At what level of summarization? • Site specific data isn’t always representative of reality • How easy do you make their retrieval of data? • Cost implications of that task • Political benefits/costs of providing access
User Access • Mechanism used to provide access • CD-ROM (Arizona) • Web access • File transfer on request • Real time data transfer • Cost to user for access?
Communications • How do you communicate with potential users? • Staff time • On-line help • None • Other
Privacy • Privacy concerns grow with increased user access and sensitivity of data being collected • Personal IDs • Vehicle tags • Driver identification (union issues)
Who Pays? • ITS systems are paid for by those who operate the system • Often the greatest use for the archive is a different group • Control of resources • Ownership • Willingness to cooperate
Traditional Performance Measures • Traditional measures • Do not describe the complexity of what is happening on the roadway • Are not easily understood by most decision makers and/or the public • Examples: • V/C Ratios: based on limited data, poor mechanism for showing changing conditions during the day • LOS: based on limited data, not meaningful over space, misunderstood • Travel time and delay: based on limited sample, or imperfect calculations
Performance Measures • When truck volume and weight data become available for freeways, these same matrices (and some assumptions) can be used to compute: • Truck hours of delay • Truck miles of delay • Ton-miles of delay • Value of freight delay
Performance Measures • Each time we use our new tools to answer a question, we develop new ways to display that information • The goal is to make that information • Easier to understand • More accurate of “real life”
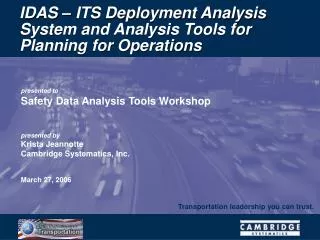
Example: FAST Nevada DOT Archived Data User Service (ADUS) FAST system architecture incorporates capability to receive, collect, and archive ITS-generated operational data including: · incident data · traffic volumes · vehicle speeds · vehicle classification · travel lane occupancy Data will be stored at periodic intervals, and will be remotely accessible by partner agencies via communication links. Data flows are defined in the FAST regional system architecture, which is consistent with the ITS National Architecture. The ADUS implementation will focus on a centralized concept where relevant data is captured, archived, and provided in a summary format to stakeholders and other FAST ITS subsystems.
Conclusions • Archived ITS Data • Performance Evaluation and Measurement Clearinghouse • Experiment With Different Measures • Freeways as a Starting Point • Arterials • Transit • Integrate Into TMC Decision Support • PeMS successfully implemented at Caltrans Districts 7 & 12
Conclusion Thank You!