Download
1 / 11
110 likes | 501 Vues
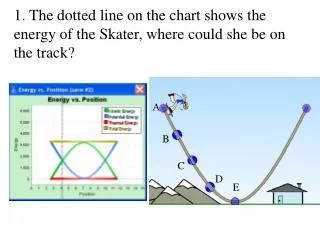
A. B. C. D. E. 1. The dotted line on the chart shows the energy of the Skater, where could she be on the track?. A. B. C. D. E. 2. The bar graph shows the energy of the Skater, where could she be on the track?. A. B. C. D. E.

E N D
A B C D E 1. The dotted line on the chart shows the energy of the Skater, where could she be on the track?
A B C D E 2. The bar graph shows the energy of the Skater, where could she be on the track?
A B C D E 3. The pie graph shows the energy of the Skater, where could she be on the track? KE PE
PE KE A. B. C. D. 1 3 4 2 4. If the ball is at point 4, which chart could represent the ball’s energy?
1 3 4 2 5. If a heavier ball is at point 4, how would the pie chart change? KE • No changes • The pie would be larger • The PE part would be larger • The KE part would be larger PE
At 4 Next step 1 3 4 2 6. As the ball rolls from point 4, the KE bar gets taller. Which way is the ball rolling? • Up • Down • not enough info
7. The Energy chart of a boy skating looks like this How would you describe his speed? • He is at his maximum speed • He is stopped • He is going his average speed • He is going slow • He is going fast
8. The Energy chart of a boy skating looks like this How would you describe his speed? • He is at his maximum speed • He is stopped • He is going his average speed • He is going slow • He is going fast
C B A 9. Select a letter for each: stopped, slow and fast
Energy vs Position 10. Sketch this energy position graph. Label where the 5 spots, A-E, could be PE KE • He is going his maximum speed • He is stopped • He is going his average speed • He is going slow • He is going fast