Refining Industry
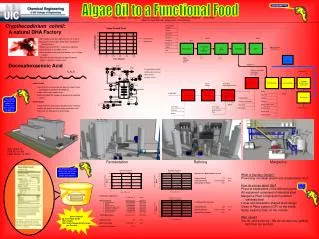
PRESENTER: Daniel Celta. Refining Industry. Downstream Training Seminar Houston, Texas March, 1999. Crude Oil. Why Do We Refine?. Crude oil cannot be used as it occurs. 4%. 4%. 10%. 16%. 18%. 7%. 44%. 26%. LPG (Gasoline) Middle Distillates (Jet Fuel & Diesel) Fuel Oil. 73%.

Refining Industry
E N D
Presentation Transcript
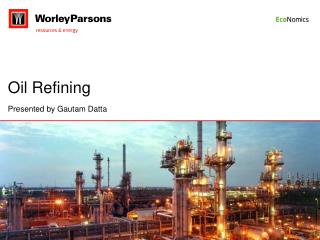
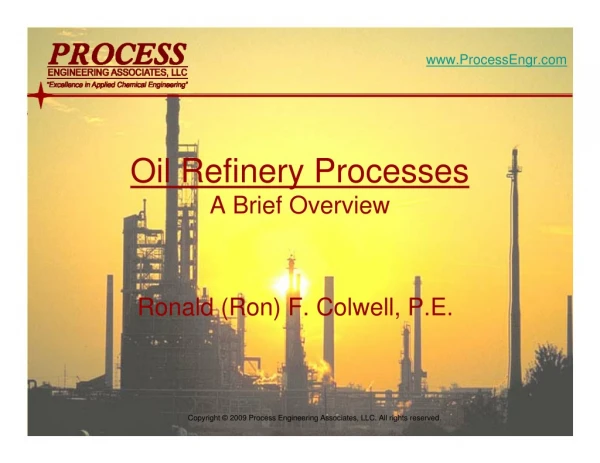
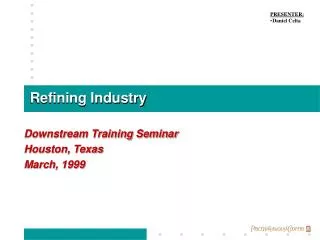
PRESENTER: • Daniel Celta Refining Industry Downstream Training Seminar Houston, Texas March, 1999
Crude Oil Why Do We Refine? Crude oil cannot be used as it occurs... 4% 4% 10% 16% 18% 7% 44% 26% LPG (Gasoline) Middle Distillates (Jet Fuel & Diesel) Fuel Oil 73% 27% 42% 19% US. Demand Arab Light Crude (After Distillation) Mexican Mayan Heavy Crude
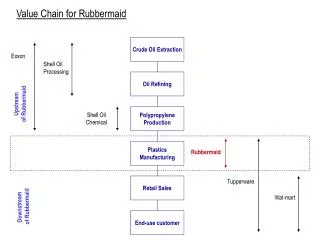
Note: Upstream gas plants are considered a “separation & treatment” process; notdownstream. PwC Value Chain—Refining Refining defined as every process inside the “Refinery Gate”... Value Chain Process Areas Acquire & Administer Leases (AQ) Explore &Develop Reserves (ED) Produce Crude, Gas & NGLs (PD) Supply, Market & Transport (ST) Market & Distribute Wholesale Products (ST) Natural Gas & LPG Refine & Process Feedstocks (RP) Sell Retail Products (SR) Bulk Hydrocarbons Process Area Detail Refine & Process Feedstocks RP PwC Citations • Determine Feedstock Selection • Receive & Load Feedstocks/Products • Manage & Optimize Process Operations • Control Plant Units • Manage Plant Inventory • Petronas - Malaysia 98/99 • Reliability Centered Maintenance • NYNAS-Sweden 98/99 • Integration of Refining Network • New Zealand Refining • Refining CI/BPT Efficiency ‘97 • Koch Industries - Corpus Christi ‘97/98 • Performance Improvement, KPI’s & Data Warehouse - Resolution • Tatneft - Moscow ‘97 • Crude Supply Planning • Pennzoil ‘96/’97 • Manufacturing SISP • Corpoven ‘96 • SAP R/3 Maintenance Installations
Refinery Benchmark Study - Solomon Solomon is a confidential, subscription series of comparative studies of refinery performance... Refinery yields Maintenance costs Capital investment Personnel count Operating expenses Process data Energy cost Complexity factors 68 refineries -- 2/3 of USA conversion capacity 4 study periods from 1986 to 1992 Scope 102 pages of input forms 44 tables, 58 pages of instructions Consistency, consistency, consistency in the basis Multiple data input coordination seminars Comprehensive Factors
Benchmarks 1996 Solomon Report Findings... • Refineries moving from being merely cost centers to more of discrete profit centers • As “discrete” units, plants are being evaluated on a “stand alone” basis • Benchmark comparisons -- Solomon Associates benchmark based operational data to produce on profitability, energy efficiency, maintenance costs, level of technology, etc. • Refinery yields • Capital investments • Operating expenses • Energy consumption • Maintenance expenditures • Personnel data • Facility data