Refining Training
Module 2. Refining Training. Refining Industry Drivers Alternative Fuel Products & Crude Sources. Section Contents. During this section you will learn. Learn the major USA refiners Factors driving future US demand and supply The importance of unconventional oil


Refining Training
E N D
Presentation Transcript
Module 2 Refining Training Refining Industry Drivers Alternative Fuel Products & Crude Sources
Section Contents During this section you will learn... • Learn the major USA refiners • Factors driving future US demand and supply • The importance of unconventional oil • New alternatives affecting refining: • Ethanol • Biofuels • Gas-to-Liquids (GTL) • “To Dig Deeper”… Websites & References
Ranking of USA Refining Companies Top 10 refiners provide 75% of the total USA capacity... Rank Company No. of U.S. U.S. Crude Refineries Capacity, BCD How the USA’s Largest Refiners Ranked as of 1/1/09 (2009) (2008) 1 1 Valero Energy Corp. 13 2,065,660 2 2 Conoco Phillips 13 2,000,200 3 3 ExxonMobil Corp. 7 1,965,750 4 4 BP PLC 6 1,401,525 5 6 Marathon Ashland, LLC 7 1,016,000 6 5 Royal Dutch/Shell 8 979,250 (1) 7 7 Chevron Corp. 5 914,000 8 8 Sunoco Inc. 5 880,000 9 9 Petroleos de Venezuela 4 849,400 (2) 10 10 Flint Hills Resources 3 817,475 11 11 Motiva Enterprises LLC 3 730,000 12 12 Tesoro Petroleum Corp. 7 658,000 13 13 Saudi Aramco 3 370,000 (3) 14 14 Lyondell Chemical Co. 1 268,000 15 Husky Energy Inc. 2 237,500 16 15 Total SA 1 231,452 17 16 EnCana Corp. 2 226,000 18 Alon USA 3 206,000 USA Crude Capacity is 17.6 million BCD in 149 operating refineries (1) Includes Shell’s stakes in Motiva and its 50% stake in the Deer Park, Texas refinery (2) Consists of PDVSA’s ownership of Citgo and its 50% stake in the its 50% stake in the ExxonMobil Chalmette, Louisiana refinery (3) Consists of 50% stake in Motiva. NPRA.org, Oil & Gas Journal, 12/22/2008
Ranking of World Refining Companies These 25 largest refiners comprise over 60% of world-wide capacity... How the World’s Largest Refiners Ranked as of 1/1/2009 Rank Company Crude Capacity (1/1/09) (1/1/08) BCD 1 1 ExxonMobil Corp. 5,632,000 2 2 Royal Dutch/Shell 4,599,000 3 3 Sinopec 3,811,000 4 4 BP PLC 3,328,000 5 6 ConocoPhillips 2,696,000 6 7 Petroleos de Venezuela 2,678,000 7 5 Total SA 2,655,000 8 8 Valero Energy Corp 2,596,000 9 9 China National Petroleum Corp. 2,440,000 10 10 Saudi Aramco 2,433,000 11 12 Petroleo Brasileiro 1,997,000 12 11 ChevronTexaco Corp. 1,981,000 13 13 Petroleos Mexicanos 1,703,000 14 14 National Iranian Oil Co. 1,451,000 15 17 Nippon Oil Co. Ltd. 1,317,000 16 15 Rosneft 1,293,000 17 16 OAO Lukoil 1,217,000 18 18 Repsol Petroleo SA 1,105,000 19 19 Kuwait National Petr. Co. 1,085,000 20 21 Marathon Ashland Petroleum 1,016,000 21 20 Pertamina 993,000 22 22 Agip Petroli SpA 904,000 23 23 Sunoco Inc. 880,000 24 24 Flint Hills Resources 817,000 25 25 SK Corp 817,000 World Crude Capacity exceeds 85.6 million BCD in 655 Refineries Capacity increased almost 300,000 BCD in 2007, primarily with “capacity creep.” Oil & Gas Journal, 12/22/08—Annual Survey
12 Increased Demand – 1.5%/yr 34 Decline in Conventional Oil Production – 4.8%/yr 51 The Problem of this Decade Integrated industry facing a different environment… World Crude Demand: Mid 2009 IEA (MMbd) 97 84.5 High risk investments and multiple options across the complete supply chain 2018 2008 IEA – International Energy Agency Outlook
Factors Driving the US Industry Long term US supply-demand driven by a variety of key assumptions... • Product Consumption: • Return of economic growth • Government policy • Alternative fuel acceptance • Ability of US Refineries to Supply Consumption: • US refining investment challenges • Deteriorating quality of conventional oil • Role of unconventional oil • Environmental legislation
Business as usual? Driver: Consumption Forecast Will economic growth restore US fuels consumption?
Policy Driver: US Car Fuel Consumption Historical perspective: US automobile fuel consumption... 40.0 New US CAFE target for vehicle fleet 35.0 30.0 25.0 Miles per Gallon 20.0 35.5 15.0 22.4 22.2 10.0 20.6 17.1 13.4 5.0 0.0 1973 1983 1993 2003 2006 2016 EIA, Monthly Energy Review, NPN 2008. NYTimes - 051809
“Policy”: Price Drives Behavior US weekly gasoline sales - impact of price... MMbd $/gallon 9.6 4.10 9.5 3.90 9.4 3.70 9.3 3.50 9.2 9.1 3.30 9.0 Impact of Price: US DOT said Americans drove an estimated 4.3 percent less -- that's 11 billion fewer miles, in March 2008 vs. March 2007. “The sharpest yearly drop for any month in history." Records have been kept since 1942. 3.10 8.9 2.90 8.8 2.70 8.7 8.6 2.50 08/29/08 09/26/08 10/10/08 09/12/08 08/15/08 10/24/08 08/01/08 Gasoline Demand (EIA) Average Price (Regular) www. IEA.org – Oil Market Report
97 MMBD 12 34 Develop & Refine Unconventional Oil Decline in Production 51 2018 Implications for Integrated Companies Refinery planning will take on new dimensions... • More Refineries, but… • Gas-to-Liquids Increased Demand
Driver: US Capacity & Number of Refineries Cheaper to expand existing plants with environmental challenges… Source: Chesnes, Matthew. Capacity and Utilization Choice in the US Oil Refining Industry. November 2008.
? 80% 1Q 2009 J. Carrig, COP, DJNews, 042309 Driver: US Refinery Utilization 100 2006 Forecast (DOE) 95 92% needed to justify new investment 90 85 Percent Utilization 1 History 80 75 70 65 60 1980 1985 1990 1995 2000 2005 2010 2015 2020 Source: U.S. Department of Energy 1 Percent utilization defined as: Gross input to refineries / operable capacity
Crude Quality Discussion Module 4 Drivers: Utilization & API of Crude Imports Refinery utilization and crude imports API gravity (1978 to 2007)…
Driver: Deteriorating Crude Oil Quality Trend is to heavier and more sour crudes in the system… Source: Chesnes, Matthew. Capacity and Utilization Choice in the US Oil Refining Industry. November 2008.
API Gravity, degrees 31.1 22.3 10.0 Extra Heavy Viscosity < 10,000 cP Light Medium Heavy Bitumen Viscosity > 10,000 cP 0.87 0.92 1.00 Specific Gravity, g/cm3 What is Heavy Oil? API gravity range of oils… (Per DOE Report R-2946, Feb 1983)
Unconventional Oil Western Hemisphere unconventional reserve base is enormous… Billion Barrels Extra-Heavy Unconventional Potential Conventional Proved
Suggest we all Start to Follow Hockey, Eh! Projects being re-evaluated: Need $70-80 a barrel for a return on new projects. Suncor can make money on existing at $30 a barrel. Equipment costs already coming down.
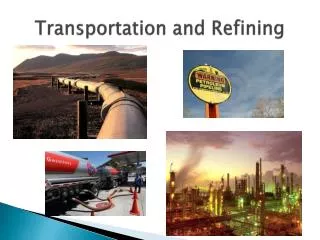
Oil Sands to US Refineries – One Option COP Keystone Pipeline Project Enabling Integrated Growth • Project being developed with TransCanada Pipeline • $2.1B project with 435 MB/D initial capacity • COP project sponsor with right to purchase 50% interest in Keystone pipeline • 2009-2010 estimated completion Hardisty Cushing Wood River Proposed 1,840 mile pipeline Proposed Cushing extension
New Products and Sources More options than ever... New Alternatives: • Ethanol • Biodiesel • Gas-to-Liquids (GTL) 97 MMBD 12 34 51 2018
I bushel of corn • 56 pounds makes • 3 gallons of ethanol Ethanol as a percentage of gasoline use 2.8% 2.0% 1.4% Source: NY Times Ethanol: Definitions Fuel on the cob… • Ethanol is grain alcohol that can be made from a variety of crops, including sugar cane, but in the USA it is mostly derived from corn. Policy makers and some environmentalists say that ethanol can help reduce reliance on imports and cut greenhouse gases. But some experts argue that the energy needed to grow the corn and produce ethanol may be more than is in a gallon of ethanol as a fuel. • Replacing MTBE. In 1990, Congress required that gasoline contain a 10 percent additive to help control smog. The original choice was methyl tertiary butyl ether. But, health and environmental concerns about MTBE have lead to a switch to ethanol as the additive in many states. • E-85 is 85 percent ethanol mixed with 15 percent gasoline. But only about 5 million “flexible-fuel” cars that can run on E-85 have been produced, out of about 238 million vehicles in use in the United States.
Biodiesel Definitions Willie a supporter – wnbiodiesel.com… • Biodiesel is the name of a clean burning alternative fuel, produced from domestic, renewable resources. • Biodiesel contains no petroleum, but it can be blended at any level with petroleum diesel. • It can be used in compression-ignition (diesel) engines with little or no modifications. • Biodiesel is simple to use, biodegradable, nontoxic, and essentially free of sulfur and aromatics. • A Long History • Using vegetable oil as a fuel dates back to 1895. • Dr. Rudolf Diesel developed the first diesel engine to run on vegetable oil. • Engine demonstrated at the World Exhibition in Paris in 1900, using peanut oil as fuel.
Update – Project Deferred May 2009 Biodiesel: ConocoPhillips Proposal Fuel from chicken-beef waste… • In April, 2007, COP & Tyson announced an alliance to produce diesel fuel made from pork, poultry and beef fat. • COP developed technology to co-process fat with hydrocarbon feedstocks last year at Whitegate refinery in Ireland. It will be tested in 4Q, 2007 at Borger. • COP will spend up to $100 mm on upgrades at Borger and other plants close to Tyson plants. • James Mulva said the effort needs the $1-per-gallon tax credit. Energy bill confusing for all tax incentives. COP’s access to the credit was denied.
Gas-to-Liquids (GTL): Produces Clean Diesel GTL a logical outlet & alternative for stranded gas… In Existence In Development Possible Source: AP in Houston Chronicle
GTL – Desert Gamble Oil giants building gas-to-liquids plants in Qatar… • $20 billion has been committed to build an unprecedented array of clean diesel plants in the Arabian Gulf. By 2011, Qatar plants should be producing 300,000 BCD of liquid fuels and other products. • Those investing include: Royal Dutch-Shell, Chevron and ExxonMobil. ExxonMobil original $7 billion bet on GTL – their largest investment in history….has been deferred. Source: AP in Houston Chronicle
Capacity reduction with Exxon cancellation X Qatar Projects Currently Dominate Growth is not without challenges… 1,200 • Industry projections suggest total GTL capacity could be ~ 1000 MBD by 2020 • Qatar could have two thirds of GTL capacity • Current worldwide GTL Capacity ~ 45 MBD • Growth rate assumes successful resolution of technical, logistical and commercial issues 900 Capacity (MBD) Total Worldwide Capacity 600 Total Qatar Capacity 300 0 Year Source: XOM GTL Outlook 2006
Today’s Challenge Carbon Emissions Proposal in place to make refiners pay for GHG released when they process crude and the emissions from vehicle tailpipes and jet engines when their fuels are burned. 1990-2000’s Clean Air Legislation Focus on the Products At $20 per ton to emit CO2, NPRA estimates the industry would be forced to pony up $4.1 billion for facility emissions and another $63 billion for emissions by consumers. Regulation Trends US refining has faced increasing regulation for over 30 years... 1970- 80’s Clean Air Legislation Focus on the Plants NPRA, Chem Systems, NPC Report
? 600 Houston Chronicle – 111608 Planned US Expansions – as of 2008 High investment cost Ethanol mandate Reduced demand Number of expansions declining as time goes by…. US Capacity Expansions 2007 through 2011 (MBD) Energy Information Agency – US
To Dig Deeper Latest references treating the environmental issues... • Facing the Hard Truths about Energy - A comprehensive view to 2030 of global oil and natural gas. http://www.npc.org/ • Transport’s role in sustaining the UK’s productivity and competitiveness, Sir Rod Eddington, December 2006. http://www.dft.gov.uk/about/strategy/eddingtonstudy/ • Sustainable Bioenergy: A Framework for Decision Makers, Mats Karlsson, Chair – UN-Energy, April, 2007. http://esa.un.org/un-energy/ • Curbing Global Energy Demand Growth: The Energy Productivity Opportunity, May, 2007, The Mckinsey Institute.http://www.mckinsey.com/mgi/publications/Curbing_Global_Energy/index.asp