Download
1 / 65
670 likes | 911 Vues
MK. MANAGEMENT AGROEKOSISTEM HUBUNGAN AIR-TANAH-TANAMAN Disarikan oleh : Prof Soemarno ( Sept 2013). Soil Water Relationships. CIRI-CIRI TANAH. Tekstur Tanah Definition: relative proportions of various sizes of individual soil particles USDA classifications Sand: 0.05 – 2.0 mm

E N D
MK. MANAGEMENT AGROEKOSISTEM HUBUNGAN AIR-TANAH-TANAMAN Disarikanoleh: Prof Soemarno ( Sept 2013) Soil Water Relationships
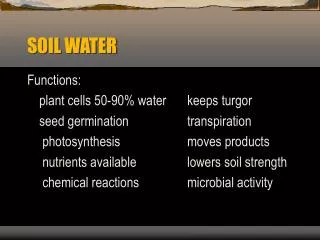
CIRI-CIRI TANAH • Tekstur Tanah • Definition: relative proportions of various sizes of individual soil particles • USDA classifications • Sand: 0.05 – 2.0 mm • Silt: 0.002 - 0.05 mm • Clay: <0.002 mm • Textural triangle: USDA Textural Classes • Coarse vs. Fine, Light vs. Heavy • Affects water movement and storage • Struktur Tanah • Definition: how soil particles are grouped or arranged • Affects root penetration and water intake and movement
SEGITIGA TEKSTUR TANAH USDA Textural Triangle
Bulk Density (b) • b = soil bulk density, g/cm3 • Ms = mass of dry soil, g • Vb = volume of soil sample, cm3 • Typical values: 1.1 - 1.6 g/cm3 • Particle Density (p) • P = soil particle density, g/cm3 • Ms = mass of dry soil, g • Vs = volume of solids, cm3 • Typical values: 2.6 - 2.7 g/cm3
Porosity () • Typical values: 30 - 60%
AIR DALAM TANAH • Kadar Air Tanah • Mass water content (m) • m = mass water content (fraction) • Mw = mass of water evaporated, g (24 hours @ 105oC) • Ms = mass of dry soil, g
Kadar air volumetrik (v) • V = volumetric water content (fraction) • Vw = volume of water • Vb = volume of soil sample • At saturation, V = • V = As m • As = apparent soil specific gravity = b/w (w = density of water = 1 g/cm3) • As = b numerically when units of g/cm3 are used • Equivalent depth of water (d) • d = volume of water per unit land area = (v A L) / A = v L • d = equivalent depth of water in a soil layer • L = depth (thickness) of the soil layer
Volumetric Water Content & Equivalent Depth (cm3) Equivalent Depth (cm3) (g) (g)
Volumetric Water Content & Equivalent DepthTypical Values for Agricultural Soils Soil Solids (Particles): 50% 0.50 in. 1 in. Very Large Pores: 15% (Gravitational Water) 0.15 in. Total Pore Space: 50% Medium-sized Pores: 20% (Plant Available Water) 0.20 in. Very Small Pores: 15% (Unavailable Water) 0.15 in.
Daya Simpan Air = Water-Holding Capacity of SoilEffect of Soil Texture Coarse Sand Silty Clay Loam Dry Soil Gravitational Water Water Holding Capacity Available Water Unavailable Water
POTENSIAL AIR TANAH • DESKRIPSI • Measure of the energy status of the soil water • Important because it reflects how hard plants must work to extract water • Units of measure are normally bars or atmospheres • Soil water potentials are negative pressures (tension or suction) • Water flows from a higher (less negative) potential to a lower (more negative) potential
PotenSial AIR TANAH • Komponen • t = total soil water potential • g = gravitational potential (force of gravity pulling on the water) • m = matric potential (force placed on the water by the soil matrix – soil water “tension”) • o = osmotic potential (due to the difference in salt concentration across a semi-permeable membrane, such as a plant root) • Matric potential, m, normally has the greatest effect on release of water from soil to plants
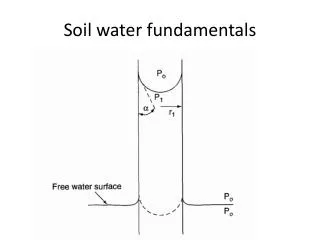
Kurva pelepasan air tanah • Curve of matric potential (tension) vs. water content • Less water more tension • At a given tension, finer-textured soils retain more water (larger number of small pores)
Potential Matriks dan Tekstur Tanah The tension or suction created by small capillary tubes (small soil pores) is greater that that created by large tubes (large soil pores). At any given matric potential coarse soils hold less water than fine-textured soils. Height of capillary rise inversely related to tube diameter
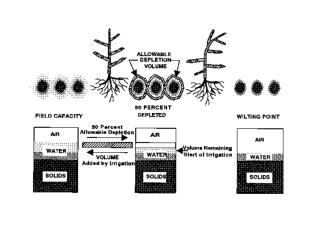
Kapasitas Lapang= Field Capacity (FC or fc) • Soil water content where gravity drainage becomes negligible • Soil is not saturated but still a very wet condition • Traditionally defined as the water content corresponding to a soil water potential of -1/10 to -1/3 bar • Titik Layu Permanen: Permanent Wilting Point (WP orwp) • Soil water content beyond which plants cannot recover from water stress (dead) • Still some water in the soil but not enough to be of use to plants • Traditionally defined as the water content corresponding to -15 bars of SWP
AIR TERSEDIA • Definition • Water held in the soil between field capacity and permanent wilting point • “Available” for plant use • Kapasitas Air Tersedia: Available Water Capacity (AWC) • AWC = fc - wp • Units: depth of available water per unit depth of soil, “unitless” (in/in, or mm/mm) • Measured using field or laboratory methods (described in text)
Fraction available water depleted (fd) • (fc - v) = soil water deficit (SWD) • v = current soil volumetric water content • Fraction available water remaining (fr) • (v - wp) = soil water balance (SWB)
Total Air Tersedia: Total Available Water (TAW) TAW = (AWC) (Rd) • TAW = total available water capacity within the plant root zone, (inches) • AWC = available water capacity of the soil, (inches of H2O/inch of soil) • Rd = depth of the plant root zone, (inches) • If different soil layers have different AWC’s, need to sum up the layer-by-layer TAW’s TAW = (AWC1) (L1) + (AWC2) (L2) + . . . (AWCN) (LN) - L = thickness of soil layer, (inches) - 1, 2, N: subscripts represent each successive soil layer [Error on page 26 of text: change SWD TAW ]
Gravity vs. Capillarity Horizontal movement due to capillarity Vertical movement due largely to gravity
Infiltrasi Air Def’n.: the entry of water into the soil Influencing Factors • Soil texture • Initial soil water content • Surface sealing (structure, etc.) • Soil cracking • Tillage practices • Method of application (e.g., Basin vs. Furrow) • Water temperature
Infiltration Rate vs. Time For Different Soil Textures
Soil Infiltration Rate vs. Constant Irrigation Application Rate
Soil Infiltration Rate vs. Variable Irrigation Application Rate
KEDALAMAN PENETRASI • Can be viewed as sequentially filling the soil profile in layers • Deep percolation: water penetrating deeper than the bottom of the root zone • Leaching: transport of chemicals from the root zone due to deep percolation
Gravimetric Measures mass water content (m) Take field samples weigh oven dry weigh Advantages: accurate; Multiple locations Disadvantages: labor; Time delay Feel and appearance Take field samples and feel them by hand Advantages: low cost; Multiple locations Disadvantages: experience required; Not highly accurate Pengukura Air Tanah
Pengukuran Air Tanah • Neutron scattering (attenuation) • Measures volumetric water content (v) • Attenuation of high-energy neutrons by hydrogen nucleus • Advantages: • samples a relatively large soil sphere • repeatedly sample same site and several depths • accurate • Disadvantages: • high cost instrument • radioactive licensing and safety • not reliable for shallow measurements near the soil surface • Dielectric constant • A soil’s dielectric constant is dependent on soil moisture • Time domain reflectometry (TDR) • Frequency domain reflectometry (FDR) • Primarily used for research purposes at this time
Pengukuran Air Tanah • Tensiometers • Measure soil water potential (tension) • Practical operating range is about 0 to 0.75 bar of tension (this can be a limitation on medium- and fine-textured soils) • Electrical resistance blocks • Measure soil water potential (tension) • Tend to work better at higher tensions (lower water contents) • Thermal dissipation blocks • Measure soil water potential (tension) • Require individual calibration
Tensiometer for Measuring Soil Water Potential Water Reservoir Variable Tube Length (12 in- 48 in) Based on Root Zone Depth Porous Ceramic Tip Vacuum Gauge (0-100 centibar)
. Evaluation of silvicultural treatment effects on infiltration, runoff, sediment yield, and soil moisture in a mixed conifer New Mexico forest A. Madrid, A.G. Fernald, T.T. Baker, and D.M. VanLeeuwen Journal of Soil and Water Conservation May/June 2006 vol. 61 no. 3 159-168 Clearing ponderosa pine forests often increases post-harvest runoff and sediment yield, yet there is little research to show if partial thinning of mixed conifer forests similarly produces more runoff and sediment. Rainfall simulations were used to evaluate silvicultural treatment effects on infiltration, runoff, sediment yield, and soil moisture in a southern New Mexico mixed conifer forest. Silvicultural treatments included: untreated control; precommercial thin with slash piled; and precommercial thin with slash scattered. There were no significant differences in infiltration rates, runoff rates, or soil moisture. Time to peak runoff was greater on pile and scatter treatments than on the control during both dry and wet runs. Sediment yield was greater on pile and scatter treatments than on the control during wet runs, yet was very low in all cases. We conclude that southwestern mixed conifer forests may be partially thinned without risk of significant increases in hillslope runoff and sediment yield.
Infiltration, water repellency, and soil moisture content after broadcast burning a forest site in southwest Oregon D.H. McNabb, F. Gaweda, and H.A. Froehlich Journal of Soil and Water Conservation January/February 1989 vol. 44 no. 1 87-90 Broadcast burning a harvested site in the Mixed-Evergreen Forest Zone of southwest Oregon in June increased the water repellency and decreased the infiltration rate of the surface soil for about 5 months. Both the infiltration rate and the water repellency returned to nearly preburn levels by late November. Measuring water repellency by the apparent contact angle produced closer correlation with changes in infiltration capacity than using the water-drop-penetration-time test in the field. During the first summer, the moisture content of soil in the burned plots remained higher than in the unburned plots.
Management effects of crops and crop strip widths on crop yield and conservation of soil and moisture on a limited-resource farm U. R. Bishnoi, H. B. Ide, and D. A. Mays Journal of Soil and Water Conservation March/April 1991 vol. 46 no. 2 147-150 Terracing and other conventional methods of soil and water conservation are often too expensive for limited-resource farmers to implement. Therefore, research to determine the effects of three strip widths and three vegetable crops on runoff, soil loss, soil moisture, plant canopy, and crop yield was conducted on a small farm. The experimental site was located on a well-drained Baxter cherty silt loam soil (Typic Paleudult) with a 6% slope and a pH of 6.5. Three crops, sweet corn (Lea mays rugose L.), cv. Silver Queen; snap beans (Phaseolus vulgaris h.), cv. Contender; and cucumbers (Cucumis sativus L.), cv. Explorer, were planted at three different strip widths (1.8, 5.5, and 7.3 m) in a split-plot design with four replications, where strip widths were the main plots and crops were randomized as subplots. Runoff from the 7.3-m plot width was 60% and 13% less than that from the 1.8-m and 5.5-m plot widths, respectively. Significantly less runoff was obtained from cucumbers than from other crops. Cucumbers allowed less soil loss (1.7 Mg ha−1) than sweet corn (1.8 Mg ha−1) and snap beans (2.1 Mg ha−1). Among the three crops, the most soil water was observed with cucumber. Significantly denser canopy cover and greater moisture was obtained with the 7.3-m strip width for all crops. Cucumber canopy was 11% and 38% greater than that for sweet corn and snap beans, respectively. Sweet corn planted in narrow strips produced a significantly higher yield (37,500 ears ha−1) than sweet corn planted in wide strips (33,600 ears ha−1). The highest yield of snap beans (5,890 kg ha−1) was observed with a 5.5-m strip width, whereas cucumbers produced most (48,710 kg ha−1) in the 7.3-m wide strip.
Influence of conservation tillage on soil properties R. L. Blevins, M. S. Smith, G. W. Thomas, and W. W. Frye Journal of Soil and Water Conservation May/June 1983 vol. 38 no. 3 301-305 Conservation of soil moisture is one of the major advantages of no-till crop production systems. In a long-term tillage study, higher soil moisture under no-till corn production was observed as compared with that under conventional tillage throughout the growing season. Significantly less evaporation occurred under no-till early in the growing season. This conservation of soil water may carry the no-till crop through short drought periods without severe moisture stresses developing in the plants. However, the extra water conserved under no-till can occasionally be detrimental under conditions in which excessive soil water contributes to denitrification losses. Soil compaction in no-tillage soils was not found to be a problem. Saturated hydraulic conductivity measurements suggest better water movement in no-tillage compared with conventional tillage. After 10 years of continuous no-till corn production, no deterioration of soil physical properties was observed. The most obvious chemical change was the rapid acidification of the soil surface when high nitrogen fertilizer rates were used. Associated with reduced soil pH were increased levels of exchangeable aluminum and manganeses. Exchangeahle calcium was sgnificantly lower for no-till at all soil depths and all nitrogen fertilizer rates compared with conventional tillage. Potassium was concentrated in the 0-to-5-centimeter soil layer under no-till and decreased with depth. Exchangeable magnesium in the 0-to-5-centimeter soil depth declined with increased nitrogen fertilizer and was lower in no-till than in conventional tillage. Organic matter was twice as high in the 0-to-5-centimeter soil depth compared with conventional tillage systems. This modified soil environment affects chemical reactions and the distribution and activity of microbes. It also has a significant effect on the fate of surface-applied nitrogen fertilizer. Methods and time of nitrogen fertilizer application may need some modification to reduce possible nitrogen losses by denitrification or temporary immobilization of nitrogen.
Soil organic matter and available water capacity Berman D. Hudson Journal of Soil and Water Conservation March/April 1994 vol. 49 no. 2 189-194 For the last 50 years, the consensus view among researchers has been that organic matter (OM) has little or no effect on the available water capacity (AWC) of soil. The historical development of this viewpoint is traced. It is argued that the the literature on this subject has been misconstrued and that the consensus view is wrong. In addition to a critical review of the literature, published data were evaluated to assess the effect of OM content on the AWC of surface soil within three textural groups. Within each group, as OM content increased, the volume of water held at field capacity increased at a much greater rate (average slope = 3.6) than that held at the permanent wilting point (average slope = 0.72). As a result, highly significant positive correlations were found between OM content and AWC for sand (r2 = 0.79***), silt loam (r2 = 0.58***) and silty clay loam (r2 = 0.7G***) texture groups. In all texture groups, as OM content increased from 0.5 to 3%, AWC of the soil more than doubled. Soil OM is an important determinant of AWC because, on a volume basis, it is a significant soil component. In this study, one to 6% OM by weight was equivalent to approximately 5 to 25% by volume.
Responses of Irrigation Water Use and Productivity of Sweet Cherry to Single-Lateral Drip Irrigation and Ground Covers Yin, Xinhua; Seavert, Clark F.; le Roux, Jac Soil Science. 176(1):39-47, January 2011. A field experiment was conducted to evaluate the transitional impacts of single-lateral drip irrigation versus microsprinkler irrigation and wheat straw mulch, black polypropylene cover, and white polypropylene cover versus no ground cover (but herbicides were used to control weeds) on irrigation water use and productivity of sweet cherry (Prunus avium L.) trees (Lapins on Mazzard rootstock) on a fine loam soil at The Dalles, OR, from 2005 through 2007 in a split-plot design with four replicates. Our results showed that during the entire irrigation season from May to October, drip irrigation consumed only 21% to 29% of irrigation water relative to microsprinkler irrigation, the current irrigation system, averaged over the four ground cover systems in the 3 years. Water use efficiency was enhanced by 167% to 234% with drip irrigation over microsprinkler irrigation. Fruit yield and fruit quality including firmness, color, and size did not differ regardless of irrigation or ground cover system. Drip irrigation increased marketable fruit by 7% to 12% via reducing fruit surface pitting and bruising compared with microsprinkler. Straw mulch, black polypropylene cover, and white polypropylene cover also increased the percentage of marketable fruit in 1 out of 3 years. Overall, shifting from microsprinkler irrigation to single-lateral drip irrigation does not result in significant negative impacts on fruit yield or quality of bearing sweet cherry trees. Single-lateral drip irrigation has the potential to be a viable alternate irrigation system for sweet cherry production, where severe shortage of irrigation water occurs.
Effects of soil moisture, temperature, and nitrogen fertilization on soil respiration and nitrous oxide emission during maize growth period in northeast China Changchun Songa* & Jinbo Zhangbpages 97-106 Acta Agriculturae Scandinavica, Section B - Soil & Plant Science Volume 59, Issue 2, 2009 To evaluate the response of soil respiration and nitrous oxide (N2O) emission to soil moisture, temperature and nitrogen fertilization, and to estimate the contribution of soil and rhizosphere to total soil carbon dioxide (CO2) and N2O emissions, a field experiment was conducted in the Sanjiang Mire Wetland Experimental Station, Chinese Academy of Sciences, in the northeast of China. The experiment included four treatments: bare soil fertilized with 150 kg N ha−1 yr−1 (CK), and maize-cropped soils amended with 0 (N0), 150 (N150), and 250 (N250) kg N ha−1 yr−1. The cumulative soil CO2 emission in the CK, N0, N150, and N250 treatments was estimated to be 698, 863, 962, and 854 g CO 2 C m−2, respectively. The seasonal soil CO2 fluxes were significantly affected by soil temperature, with a Q10 value between 1.99 and 2.47. Analysis of the stepwise regression indicated that the CO2 flux can be quantitatively described by a linear combination of soil moisture content and soil temperature 5 cm below ground. Approximately 70, 58, 60, and 44% of the variability in CO2 flux can be explained by these two parameters, in CK, N0, N150, and N250, respectively. Nitrogen fertilization with 150 kg N ha−1 yr−1 increased CO2 fluxes by 14.5% compared with soils fertilized with 0 kg N ha−1 yr−1. However, in the soil fertilized with 250 kg N ha−1 yr−1, high N fertilization suppressed soil respiration. There was an exponential relationship between soil temperature 5 cm below ground and N2O flux, with a Q10 value of 1.30–2.91. Mean cumulative soil N2O emissions during the maize-growing season in the CK, N0, N150, and N250 treatments were estimated to be 86, 44, 200, and 484 mg N2O-N m−2, respectively. In contrast to the maize planting, soil fertilized with 150 kg N ha−1 yr−1 and with 250 kg N ha−1 yr−1 increased N2O fluxes by 354 and 1000%, compared with soils fertilized with 0 kg N ha−1 yr−1, respectively. Soil respiration and N2O fluxes measurement using the root-exclusion technique indicated that the rhizosphere of the maize could be the dominant habitat of soil respiration and N2O formation.
Scaling Effect of the Hydraulic Conductivity in a Confined Aquifer Fallico, Carmine; Vita, Maria Chiara; De Bartolo, Samuele; Straface, Salvatore Soil Science. 177(6):385-391, June 2012. Previous studies showed that the values of the representative parameters of an aquifer, such as the hydraulic conductivity (k), increase with the scale, that is, with the aquifer volume involved in the measurement. The main cause of this behavior is commonly ascribed to the heterogeneity of the porous media. Heterogeneity influences the scaling behavior differently for laboratory or field measurement, but the scale dependence of hydraulic conductivity is not dependent on the specific measurement method. In the present study, the scaling law of this parameter was determined on a real confined aquifer, using measurements obtained, both in the laboratory (flow cells) and the field (slug tests and aquifer tests). The corresponding data were statistically analyzed. A scaling law was proposed for both the laboratory and field scale, using the data obtained from flow cells, slug tests, and aquifer tests. Afterward, the scaling law was estimated at just the field scale, first using the slug tests and aquifer tests and then using only the aquifer test data. The scale dependence of the storativity was also investigated for all field measurements and then using only the aquifer test data. In conclusion, for both hydraulic conductivity and storativity, the trend to reach an upper bound increasing the scale parameter was investigated in the scale ranges of 67 and 99 m, respectively, examining only the data set relative to aquifer test measurements.
Estimation of Soil-Water Retention From Particle-Size Distribution: Fractal Approaches Ghanbarian-Alavijeh, Behzad; Hunt, Allen G. Soil Science. 177(5):321-326, May 2012. Soil-water retention curve (SWRC) is one of the most important properties of porous media whose estimation is still under investigation by either physically based approaches or empirically developed models. In this short communication, the authors reviewed three well-known fractal approaches, that is, Kravchenko and Zhang, the pore-solid fractal, and Hunt and Gee methods, which estimate SWRC from particle-size distribution. The authors argue that the most reliable method is to use Hunt and Gee’s approach to estimate SWRC, then modify the estimated equilibrium water content by the Hunt and Skinner algorithm for nonequilibrium conditions.
Temporal Variability of Bulk Density and Soil Water at Selected Field Sites Logsdon, Sally D. Soil Science. 177(5):327-331, May 2012. Soil bulk density is not a fixed property but varies spatially because of soil differences and temporally because of management and climate effects. The purposes of this study were to determine the relation of bulk density and water table depth with soil properties for wet and dry measurement dates and to compare the correlation of soil properties with mass and volumetric water content. Volumetric soil samples were collected at 15 or 16 field sites on 37 dates over 5 years. At the same time, water table depths were determined. The soil samples were used to determine volumetric and mass water contents and bulk densities. Other soil properties were used to develop orthogonal Principal Component 1 (PC1). The fractions of soil or landscape properties contributing to PC1 were as follows: sand, 0.40; silt, −0.38; clay, −0.39; color index, −0.38; distance above short-range low point, 0.35; distance above longer-range low point, 0.29; profile curvature, 0.27; and plane curvature, 0.34. Principal Component 1 was positively correlated with bulk density for 24 of 27 wet measurement dates, but only 4 of 10 dry dates. Volumetric soil-water content was negatively correlated with bulk density for 9 of the 10 dry dates, but only 19 of the 27 wet dates. Mass water content had slightly higher correlations with PC1 than did volumetric water content, but both were significantly correlated for 36 of the 37 measurement dates. Dividing measurement dates into “wet” and “dry” facilitated interpretation of bulk density variation at the 15 or 16 sample locations.
Hydraulic Conductivity Increases in a Sodic Clay Soil in Response to Gypsum Applications: Impacts of Bulk Density and Cation Exchange Reading, Lucy P.; Baumgartl, Thomas; Bristow, Keith L.; Lockington, David A. Soil Science. 177(3):165-171, March 2012. Amelioration of sodic soils is commonly achieved by applying gypsum, which increases soil hydraulic conductivity by altering soil chemistry. The magnitude of hydraulic conductivity increases expected in response to gypsum applications depends on soil properties including clay content, clay mineralogy, and bulk density. The soil analyzed in this study was a kaolinite rich sodic clay soil from an irrigated area of the Lower Burdekin coastal floodplain in tropical North Queensland, Australia. The impact of gypsum amelioration was investigated by continuously leaching soil columns with a saturated gypsum solution, until the hydraulic conductivity and leachate chemistry stabilized. Extended leaching enabled the full impacts of electrolyte effects and cation exchange to be determined. For the columns packed to 1.4 g/cm3, exchangeable sodium concentrations were reduced from 5.0 ± 0.5 mEq/100 g to 0.41 ± 0.06 mEq/100 g, exchangeable magnesium concentrations were reduced from 13.9 ± 0.3 mEq/100 g to 4.3 ± 2.12 mEq/100 g, and hydraulic conductivity increased to 0.15 ± 0.04 cm/d. For the columns packed to 1.3 g/cm3, exchangeable sodium concentrations were reduced from 5.0 ± 0.5 mEq/100 g to 0.51 ± 0.03 mEq/100 g, exchangeable magnesium concentrations were reduced from 13.9 ± 0.3 mEq/100 g to 0.55 ± 0.36 mEq/100 g, and hydraulic conductivity increased to 0.96 ± 0.53 cm/d. The results of this study highlight that both sodium and magnesium need to be taken into account when determining the suitability of water quality for irrigation of sodic soils and that soil bulk density plays a major role in controlling the extent of reclamation that can be achieved using gypsum applications.
Emergent Behavior of Soil Fungal Dynamics: Influence of Soil Architecture and Water Distribution Falconer, Ruth E.; Houston, Alasdair N.; Otten, Wilfred; Baveye, Philippe C. Soil Science. 177(2):111-119, February 2012. Macroscopic measurements and observations in two-dimensional soil-thin sections indicate that fungal hyphae invade preferentially the larger, air-filled pores in soils. This suggests that the architecture of soils and the microscale distribution of water are likely to influence significantly the dynamics of fungal growth. Unfortunately, techniques are lacking at present to verify this hypothesis experimentally, and as a result, factors that control fungal growth in soils remain poorly understood. Nevertheless, to design appropriate experiments later on, it is useful to indirectly obtain estimates of the effects involved. Such estimates can be obtained via simulation, based on detailed micron-scale X-ray computed tomography information about the soil pore geometry. In this context, this article reports on a series of simulations resulting from the combination of an individual-based fungal growth model, describing in detail the physiological processes involved in fungal growth, and of a Lattice Boltzmann model used to predict the distribution of air-liquid interfaces in soils. Three soil samples with contrasting properties were used as test cases. Several quantitative parameters, including Minkowski functionals, were used to characterize the geometry of pores, air-water interfaces, and fungal hyphae. Simulation results show that the water distribution in the soils is affected more by the pore size distribution than by the porosity of the soils. The presence of water decreased the colonization efficiency of the fungi, as evinced by a decline in the magnitude of all fungal biomass functional measures, in all three samples. The architecture of the soils and water distribution had an effect on the general morphology of the hyphal network, with a “looped” configuration in one soil, due to growing around water droplets. These morphologic differences are satisfactorily discriminated by the Minkowski functionals, applied to the fungal biomass.
Fractal Description of the Spatial and Temporal Variability of Soil Water Content Across an Agricultural Field Vidal-Vázquez, Eva; Paz-Ferreiro, Jorge; Vieira, Sidney; Topp, George; Miranda, José; Paz González, Antonio Soil Science. 177(2):131-138, February 2012. There is an increasing interest in quantifying the space-time variation of soil properties. This issue offers a unique set of problems that have been addressed using various methods. Here, the spatial and temporal scaling behavior of topsoil water content at the field scale was explored using the fractal approach. Results from fractal analysis were compared with those from other methods describing either spatial variability or temporal trends and stability of soil moisture. Time domain reflectometry probes were installed at the 0- to 20-cm depth in a clay loam soil under natural pasture in Ottawa, Ontario, Canada. Soil water content was measured 34 times at 164 points on a square grid with 10-m spacing. Mean soil water content and coefficients of variation showed significant negative linear relationship for both sampling dates (r2 = 0.783) and sampling points (r2 = 0.804). Both spatial and temporal data sets were characterized by a self-affine fractal Brownian motion model that requires two parameters, fractal dimension, D, and crossover length, l. For spatially sampled data sets at different times, D ranged from 2.589 to 2.910 and l ranged from 0.95 to 6.97 m. For temporal data sets measured on 10-m grid nodes, D was between 1.145 and 1.919 and l was from 0.069 to 9.40 days. Fractal analysis added information on the scale dependence of spatially and temporally sampled data sets, which is not taken into account by classical statistics. Also, interpretation of fractal parameters provided further insight when contrasted with temporal stability analysis. Fractal dimension and crossover length of temporal series showed spatial dependence, and ordinary kriging was used to map these two fractal parameters.
Evaluation of Drip and Subsurface Drip Irrigation in a Uniform Loamy Soil Rodríguez-Sinobas, Leonor; Gil, María; Sánchez, Raúl; Benitez, Javier Soil Science. 177(2):147-152, February 2012. Drip irrigation DI is considered one of the most efficient irrigation methods. Subsurface DI (SDI) is also a localized irrigation method, but laterals are deployed underneath the soil surface, leading to a higher potential efficiency. Among other factors, water distribution in SDI is affected by soil hydraulic properties, initial water content, emitter’s discharge, and irrigation frequency. However, complexity arising from soil water and profile characteristics means that these are often not properly considered in the design and management of these systems. In this article, irrigation uniformity in DI and SDI laterals was determined by field evaluations in a loamy soil at different inlet head pressures. Water application uniformity was very good for both irrigation methods, and differences between them were negligible. Thus, both methods may be suitable for this soil within the pressure range evaluated. The wetting pattern dimensions after infiltration for both methods were simulated with Hydrus-2D under field conditions. Wetting bulb size for DI was smaller than SDI; thus, it requires higher irrigation times to wet the same root zone. For the loamy soil, an emitter depth greater than 10 cm is advisable to prevent soil surface wetting for irrigation times higher than 30 min. Differences observed for 0.2- and 0.3-m depths were negligible. Simulations for different scenarios are depicted in graphs that might aid at the selection of proper design variables (emitter depth) and/or operation variables (inlet head and irrigation time) in the studied soil. Similar graphs could also be developed for other soils.
Irrigation-Induced Changes in Phosphorus Fractions of Caribou Sandy Loam Soil Under Different Potato Cropping Systems He, Zhongqi; Zhang, Hailin; Zhang, Mingchu Soil Science. 176(12):676-683, December 2011. Sequential fractionation is a common method used in evaluating the impacts of soil management practices on soil phosphorus (P) distribution. However, to our knowledge, this method has not been used in investigating the effects of irrigation on the changes in soil P fractions. In this work, we measured sequentially extracted P by deionized H2O, 0.5 M sodium bicarbonate (pH 8.5), 0.1 M sodium hydroxide (NaOH), and 1 M hydrochloric acid (HCl) in Caribou sandy loam soil samples from 10 potato fields under different 3-year crop rotations both with and without irrigation. As inorganic fertilizer was applied to these fields, irrigation and rotation management practices mainly affected the distribution of inorganic P fractions, but had no significant changes of organic P fractions. The impact of crop rotation was mainly reflected by H2O-extractable P. Irrigation had greater influence on stable or recalcitrant P in NaOH, HCl, and residual fractions. Higher levels of NaOH-extractable inorganic P were observed in soil from rainfed fields, whereas higher levels of HCl-extractable P were observed in soils under irrigated management. Our data indicate that irrigation may eventually decrease P availability and runoff potential in these potato soils over the long term because of the partial transfer of P in the sink from the active NaOH fraction to more stable HCl and residual fractions. Whereas information and knowledge derived from this study may shed some light on the transformation mechanism of soil P fractions for sustainable agricultural production, more field data from short- and long-term experiments are needed to confirm our observations.