Download
1 / 22
220 likes | 354 Vues
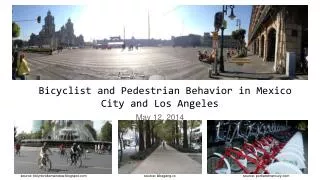
Bicyclist and Pedestrian Behavior in Mexico City and Los Angeles. May 12, 2014. source: bklynbrokenwindow.blogspot.com. source: bikegang.cc. source: portlandmercury.com. Overview. Measuring Road Efficiency Mexico City Video Pedestrian and Bicycle Infrastructure Discussion

E N D
Bicyclist and Pedestrian Behavior in Mexico City and Los Angeles May 12, 2014 source: bklynbrokenwindow.blogspot.com source: bikegang.cc source: portlandmercury.com
Overview Measuring Road Efficiency Mexico City Video Pedestrian and Bicycle Infrastructure Discussion Recommendations & Los Angeles Video Conclusion
Key Themes • “You manage what you measure” • Three priorities: • Capacity • Safety • Inclusion
Level of Service (LOS): • Focus on congestion mitigation • Auto-centric • But is congestion such a bad thing? • Decreased severity and number of collisions • Rationing an over-utilized public good (Downs) • reflects social and economic vitality (Taylor) Source: clarkesvillesmartgrowth.com
What do cyclists and pedestrians like? Let’s travel to Mexico City to find out!
What do Pedestrians want? • Congestion! • shorter crossing distances • preponderance of shops • proximity to transit, bikeshare, green space
What do cyclists want? • better infrastructure • streets with less automobile traffic • proximity to transit, bikeshare, green space
Los Angeles Bike Plan Implementation Miles of Bike Infrastructure Installed
Recommendations: • Implement Protected Bike Lanes • Follow incremental Bike-share model • Re-allocate underutilized road space to pedestrians • Have more public events Source: losangeleswalks.org Source: latimesblog.latimes.com Source: inhabitat.com
Conclusion • City needs to measure what it manages • Need to have a more balanced transportation system • Separate infrastructure when possible • Optimism
Thank you! Dustin Foster, MPP* dustin.foster@lacity.org
Capacity 20-24000 people at 60 MPH (I-405)
Safety: bike and ped collisions -1,000 randomly selected collisions -also compare 5-10 streets based on capacity (lanes, speed limits)
Are Streets Places of Exclusion or Inclusion? Mode Share, Google maps screen shots
Bicycle Infrastructure Comparison: Bike Lanes implemented index (2010-2014): • M*S M= Miles of Bike Lanes Implemented in 5 years S= (% Reduction in Collisions) Mexico City: 30.6*(?) Los Angeles: