Pedestrian and Bicyclist Data
250 likes | 376 Vues
This presentation by Shawn Turner, P.E., at the Texas Transportation Institute discusses the critical importance of bicycling and walking data in urban planning. It outlines the types of data needed, such as facility inventories, usage characteristics, and crash statistics, to support informed policy decisions and effective investments in transportation infrastructure. The session also highlights the challenges in collecting data for these “forgotten modes” of transportation and presents innovative data collection methods and grassroots initiatives to improve monitoring and performance measurement.

Pedestrian and Bicyclist Data
E N D
Presentation Transcript
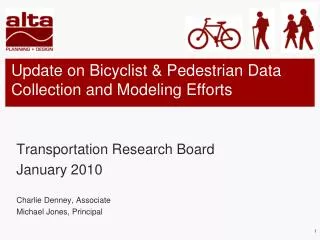
Pedestrian and Bicyclist Data Shawn Turner, P.E. Texas Transportation Institute H-GAC Brown Bag Luncheon Houston, TX ~ October 24, 2011
Overview • Why is bicycling & walking data important? • What data do we need? • National / international activities
Why is bicycling and walkingdata important? • Same reasons as for other modes • Support policy decisions/changes • Plan for cost-effective investments • Design safe facilities and infrastructure • Measure performance and progress toward goals • “What gets measured, gets done” • “If you’re not counted, you don’t count”
Portland Examples Source: Roger Geller, City of Portland
Portland Examples Source: Roger Geller, City of Portland
Portland Examples Source: Roger Geller, City of Portland
What data do we need? • Maintain focus on users and uses of data! • Who needs information (based on your data)? • What decisions are they making? • Avoid collecting data only because: • “that’s what our program plan lists…” • “that’s what my boss said to do…” • “that’s what others are doing…”
Bicycle and Pedestrian Data • Facilities (inventory) • LOS, quality of travel • Usage, trip & user characteristics • Counts, surveys • Crash & safety data • User preferences • Secondary data • Research and evaluation data
Data & Monitoring Challenges • “The forgotten modes” (Tom Larson) • Typically lower priority, fewer resources • Typically small numbers, high variability • Typically on city streets, not major highways • Difficult to automatically count/measure • Scale of facilities
Field Tests of Counters • Texas A&M Campus, College Station • ~2 hours, 470 people (15% in groups) • Brand A, 34% low • Brand B, 11% low • Pfuger Bridge (jogging trail), Austin • In ~2 hours, 967 people (47% in groups) • Brand A, 36% low • Brand B, 26% low • Brand C, 24% low
Austin Regional Monitoring Program State-of-the-practice review Purchased 2 permanent counters and 2 portable counters from Eco Counter http://www.campotexas.org/programs_bicped.php
Opportunities and Advances - 1 • “Grassroots” efforts from within the pedestrian/bicyclist community
Opportunities and Advances - 2 • Map and navigation industry efforts
Opportunities and Advances - 2 • Map and navigation industry efforts
Opportunities and Advances - 2 • Map and navigation industry efforts
Opportunities and Advances - 3 • Pocket-sized, location-aware mobile devices + crowdsourcing and social media
Opportunities and Advances - 3 • Pocket-sized, location-aware mobile devices + crowdsourcing and social media
Opportunities and Advances - 3 Source: Jennifer Dill, Portland State Univ.
National Activities • Alta/ITE National Bicycle and Pedestrian Documentation Project • ABW Benchmarking Report • FHWA Update of Traffic Monitoring Guide • Supporting state-of-practice review • NCHRP 8-78: Demand Forecasting Methods • NCHRP 7-19: Count Collection Methods/Equipment • TRB Ped/Bike Data Subcommittee • And probably lots more!!
Intl. Scan Tour - Monitoring • Bike “barometers”: counters in highly visible locations
Concluding Thoughts • Progress is being made • Equipment • Monitoring programs • Travel surveys • Focus on uses and users • Who? • What decisions? • Capture passion/dedication of advocates • Mobile devices for crowd-sourced data
Questions? shawn-turner@tamu.edu (979) 845-8829 http://tti.tamu.edu