Download
1 / 35
350 likes | 524 Vues
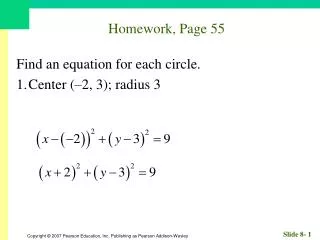
Homework, Page 749. Write each sum using summation notation, assuming the suggested pattern continues. 1. . Homework, Page 749. Write each sum using summation notation, assuming the suggested pattern continues. 5. . Homework, Page 749. Find the sum of the arithmetic sequence. 9. .

E N D
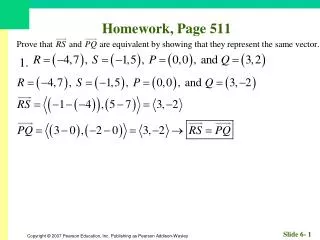
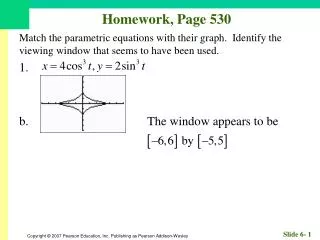
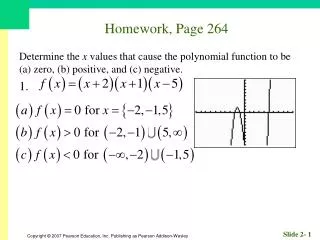
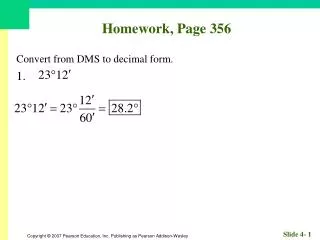
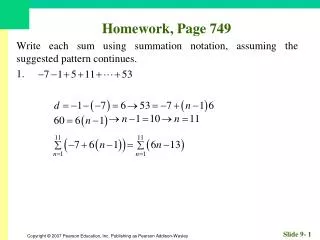
Homework, Page 749 Write each sum using summation notation, assuming the suggested pattern continues. 1.
Homework, Page 749 Write each sum using summation notation, assuming the suggested pattern continues. 5.
Homework, Page 749 Find the sum of the arithmetic sequence. 9.
Homework, Page 749 Find the sum of the geometric sequence. 13.
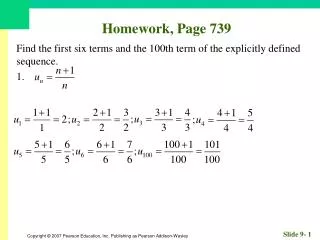
Homework, Page 749 Find the sum of the first n terms of the sequence. 17.
Homework, Page 749 Find the sum of the first n terms of the sequence. 21.
Homework, Page 749 Determine whether the infinite geometric series converges. If it does, find its sum. 25.
Homework, Page 749 Determine whether the infinite geometric series converges. If it does, find its sum. 29.
Homework, Page 749 Expression the rational number as a fraction of integers. 33.
Homework, Page 749 37. Mr. O’Hara deposits $120 at the end of each month into an account paying 7% annual interest, compounded quarterly. after ten years, the balance is a. This is a geometric series. What is the first term? What is r? The first term is 120 and r = 1.00583. b. Use the sum of the finite series to find the balance.
Homework, Page 749 41. If all terms in a series are positive, the series sums to a positive number. Justify your answer. False. The series might diverge.
Homework, Page 749 45. The sum of an infinite series whose first term is 3 and second term is 0.75 is a. 3.75 b. 2.4 c. 4 d. 5 e. 12
9.6 Mathematical Induction
What you’ll learn about • The Tower of Hanoi Problem • Principle of Mathematical Induction • Induction and Deduction … and why The principle of mathematical induction is a valuable technique for proving combinatorial formulas.
The Tower of Hanoi Solution The minimum number of moves required to move a stack of n washers in a Tower of Hanoi game is 2n – 1.
Principle of Mathematical Induction Let Pn be a statement about the integer n. Then Pn is true for all positive integers n provided the following conditions are satisfied: (the anchor) P1 is true; (inductive step) if Pk is true, then Pk+1 is true.
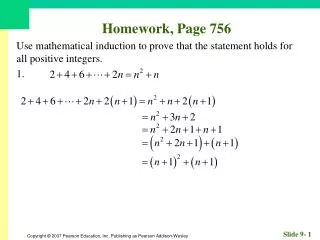
Example Proving a Statement Using Mathematical Induction Use mathematical induction to prove the statement holds for all positive integers.
Induction and Deduction • Induction - the process of using evidence from a particular example to draw conclusions about general principles • Deduction - the process of using general principles to draw conclusions about specific examples
Homework • Homework Assignment #35 • Read Section 9.7 • Page 756, Exercises: 1 – 41 (EOO) • Quiz next time
9.7 Statistics and Data (Graphical)
What you’ll learn about • Statistics • Displaying Categorical Data • Stemplots • Frequency Tables • Histograms • Time Plots … and why Graphical displays of data are increasingly prevalent in professional and popular media. We all need to understand them.
Terminology • Sets of data tabulate one or more characteristics, called variables, of each member of a population, called objects or individuals. • Categorical variable - identifies an individual as a member of a distinct class, such as male or female, or freshman, sophomore, junior, or senior • Quantitative variables have numerical values, such as height or weight
Leading Causes of Death in the United States in 2001 Cause of Death Number of Deaths Percentage Heart Disease 700,142 29.0 Cancer 553,768 22.9 Stroke 163,538 6.8 Other 1,018,977 41.3 The causes of death noted above are categorical variables. Source: National Center for Health Statistics, as reported in The World Almanac and Book of Facts 2005.
Bar Chart, Pie Chart, Circle Graph bar graph 3-D pie chart circle chart In the bar graph, the x-axis is labeled by category. Since the categories are unconnected, the bars are not adjacent to one another. The pie and circle charts demonstrate how the data in the individual categories add up to the total
Stemplots • Stemplots - a presentation of numerical data where the data is split into a stem consisting of the initial digit or digits, and a leaf, which is the final digit
Example Making a Stemplot Make a stemplot for the given data. 12.3 23.4 12.0 24.5 23.7 18.7 22.4 19.5 24.5 24.6
Frequency Table • A table showing the frequency with which data in a specified range appear in the total data set. An example would be a list of heights of students with the number of students who are at each height along side
Histogram • A histogram is a bar chart that shows the data of a frequency table in graphic form
Time Plots • Time plots show us how some particular variable changes over time. • The plot is developed by plotting the variable on the y-axis and time on the x-axis. • Individual data points are connected by straight lines to complete the time plot
Example, Page 768 2. Make a back-to-back stemplot comparing the annual home run production of Roger Maris to that of Hank Aaron.
Example, Page 768 10. Draw a histogram of the frequency table in exercise 8.
Example, Page 768 14. Make a time plot for Mickey Mantle’s annual home run totals.