Download
1 / 31
320 likes | 552 Vues
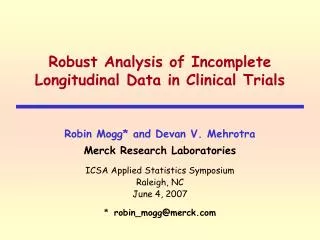
Robust Analysis of Incomplete Longitudinal Data in Clinical Trials. Robin Mogg* and Devan V. Mehrotra Merck Research Laboratories ICSA Applied Statistics Symposium Raleigh, NC June 4, 2007 * robin_mogg@merck.com. Outline. The need for an HIV Vaccine Motivating trials:

E N D
Robust Analysis of Incomplete Longitudinal Data in Clinical Trials Robin Mogg* and Devan V. Mehrotra Merck Research LaboratoriesICSA Applied Statistics SymposiumRaleigh, NCJune 4, 2007* robin_mogg@merck.com
Outline • The need for an HIV Vaccine • Motivating trials: • Two Phase IIa HIV Vaccine Trials • Numerical example • Statistical methods • Simulation results • Concluding remarks • Interactions with CBER 2007 ICSA Applied Statistics Symposium
The Need for an HIV Vaccine • UNAIDS 2005 Estimates: • 38.6 million people living with HIV worldwide;4.1 million people newly infected (>11,000/day);2.8 million people died • Antiretroviral therapy (ART): • Dramatically decreased morbidity and mortality in developed countries; treatment regimens complex and costly; globally reaches only 1 of 5 in need. • A safe and effective HIV Vaccine is the best hope for controlling/ending the AIDS epidemic. • Ideal vaccine candidate would be 100% effective in preventing infection among those uninfected. 2007 ICSA Applied Statistics Symposium
Humoral and Cellular Immunity • Immune responses of preventative vaccines are designed to mimic those from natural exposure. • Humoral immunity: mediated by virus-neutralizing antibodies, prevents virus from infecting cells. • Cellular immunity: mediated by T-lymphocytes, target and kill already infected cells. • The immune system “remembers” each encounter; basis of vaccination against infectious diseases. • In natural HIV infection: • Humoral response is not completely effective in preventing virus from infecting cells. • Success of cellular response varies, “better” responses result in lower virus and better clinical outcomes. 2007 ICSA Applied Statistics Symposium
HIV Infection Markers: CD4 count and Viral load 2007 ICSA Applied Statistics Symposium
HIV Vaccination • Merck’s HIV Vaccine is designed to induce a cell-mediated immune (CMI) response. • Prophylactic vaccination: • Goal is to induce broad cellular immune responses in HIV uninfected individuals that provides either protection from infection (sterilizing immunity) or protection from disease (low viral load setpoint, slow disease progression). • Therapeutic vaccination: • Goal is to induce broad cellular immune responses in HIV infected individuals that provides protection from disease (low viral load without ART, slow disease progression). 2007 ICSA Applied Statistics Symposium
Motiviating Trial #1:Prophylactic Proof of Concept (POC) Efficacy Trial • Design: randomized, double-blind, placebo-controlled study in a population at high risk of HIV infection. • Two co-primary endpoints: • Infection • Viral load setpoint (among those infected) • vRNA measured at time of diagnosis and at 2, 8, and 12 weeks after diagnosis. • Viral load setpoint = mean of log10(vRNA) at Weeks 8 and 12. • Hypothesis: HIV vaccination will lead to a lower incidence of HIV and/or lower viral load setpoints among infected subjects. 2007 ICSA Applied Statistics Symposium
Motiviating Trial #2: ACTG A5197Therapeutic POC Efficacy Trial • Design: randomized, double-blind, placebo-controlled study in an HIV-infected population with prolonged (>2 yrs) ART-based suppression of viral load. • After immunization phase, interrupt ART for everyone. • Primary endpoint: • Viral load setpoint • vRNA measured at 1, 2, 4, 6, 8, 12, and 16 weeks after interruption of therapy. • Viral load setpoint = mean of log10(vRNA) at Weeks 12 and 16. • Hypothesis: Therapeutic HIV vaccination will lead to better control of viral replication during ART interruption. 2007 ICSA Applied Statistics Symposium
Motiviating Trial #2 (cont.): ACTG A5197Therapeutic POC Efficacy Trial 2007 ICSA Applied Statistics Symposium
Challenge: Missing vRNA Data Due to “Drop-Outs” 2007 ICSA Applied Statistics Symposium
Numerical Example: Hypothetical Databased on Therapeutic POC Efficacy Trial 2007 ICSA Applied Statistics Symposium
Numerical Example (cont.): Hypothetical Data Vaccine Placebo Median VLS = 4.06 Median VLS = 4.36 Completers: 8/10 (80%) 8/10 (80%)Lost to Follow-up: 1/10 (10%) 1/10 (10%)Restart ART: 1/10 (10%) 1/10 (10%) Completers: 8/10 (80%) 8/10 (80%) 2007 ICSA Applied Statistics Symposium
“Standard”, but Ad hoc Statistical Methods • LOCF • Use LOCF to impute missing values after dropout. • Calculate VLS, then use a t-test. • Tied Worst Rank • Assign VLS = 10^10 to all “drop-outs”. • Use Wilcoxon Rank Sum (WRS) test. • Untied Worst Rank • Assign VLS = 10^10 – tlast to all “drop-outs”, where tlast = time of dropout (penalizes earlier dropouts). • Use Wilcoxon Rank Sum (WRS) test. 2007 ICSA Applied Statistics Symposium
Numerical Example: Hypothetical Datausing LOCF 2007 ICSA Applied Statistics Symposium
Numerical Example: Hypothetical Data using Tied Worst Rank 2007 ICSA Applied Statistics Symposium
Numerical Example: Hypothetical Data using Untied Worst Rank 2007 ICSA Applied Statistics Symposium
Other “Standard” Statistical Methods • REML: Parametric repeated measures analysis (PROC MIXED default). • Assumptions include: multivariate normality, properly modeled covariance matrix, and missing values (if any) are missing at random (MAR). • Weighted GEE: Extension of semiparametric repeated measures analysis (generalized estimating equations) to accommodate non-normality and MAR data. • Assumptions include: correct modeling of the drop-out mechanism to estimate weights (inverse probability of response) and missing values are MAR. 2007 ICSA Applied Statistics Symposium
Numerical Example: Hypothetical Datausing Weighted GEE 2007 ICSA Applied Statistics Symposium
A New Method: Two-step Approach • A rank-based analysis after multiple imputation (Mogg and Mehrotra, 2007). • Step 1: Impute missing values (Rubin, 1987) • Create M (= 20) complete data sets using SAS PROC MI to impute. • Assumptions include multivariate normality and MAR. • Step 2: Rank-based analysis • Calculate the numerator and denominator of a rank-based test statistic for each complete data set. • Combine the M results to get a single p-value for inference. • Valid inference when assumptions above are violated as long as imputations are rank preserving. 2007 ICSA Applied Statistics Symposium
A New Method: Two-step Approach (cont.) • Two options for rank-based test after imputation: 1) WRS test applied to the VLS values.[MI WRS] 2) Separate WRS tests at last two time points, combined with equal weight. (MI-based extension of Wei-Lachin, 1984.)[MI WL] • Mann & Whitney (1947) proposed a rank test equivalent to the WRS test: • In the multivariate setting, Wei and Lachin (1984) present a T-variate generalization of this test: • The vectors and , where is a vector of weights, are asymptotically normal with covariance matrices and . 2007 ICSA Applied Statistics Symposium
Numerical Example (cont.) 2007 ICSA Applied Statistics Symposium
Details of Simulation Study (based on Therapeutic POC Efficacy Trial) • 2 groups (P=Placebo, V=Vaccine); 7 time points; Total N = 120 (80 vaccine, 40 placebo) • Three data generating distributions: • MVN(,) • SCN = 0.9MVN(,) + 0.1MVN(,16) [stochastic mix] • MVT() with 3 d.f. P = Vunder H0 std dev. = 0.65, Toeplitz corr. (0.8)Under HA std dev. vaccine = 0.75 • Under H0, VLS = 4.5 for P and V • Under HA, VLS = 4.5 for P and VLS = 4.0 for V • 10,000 simulations, nominal = 2.5% (1-tailed) 2007 ICSA Applied Statistics Symposium
Details of Simulation Study (cont.) • Combination of two monotone missing data mechanisms: • MAR: Data for a subject was set to missing (subject went back on ART) with 90% probability if 2 consecutive vRNA measurements > 150,000 copies/ml. • MCAR: On average, 10% of subjects in each treatment group drop-out at a random time point (lost to follow-up). • % Missing Data by Study Week 2007 ICSA Applied Statistics Symposium
Simulation ResultsType I Error Rate (=2.5%) 2007 ICSA Applied Statistics Symposium
Simulation Results (cont.) • Severely inflated type I error for WGEE. • Agrees with other published reports (Demirtas, 2004 and Preisser et al., 2002). • WGEE performs poorly when drop-out model is not correctly specified. • Even with “reasonable” model for drop-out, WGEE method breaks down here. • Virtually impossible in practice to properly specify missing data model! 2007 ICSA Applied Statistics Symposium
Simulation ResultsPower 2007 ICSA Applied Statistics Symposium
Simulation Results when Specifying Correct Drop-out Model for WGEE 2007 ICSA Applied Statistics Symposium
Concluding Remarks • WGEE: type I error can be severely inflated when drop-out model is not correctly specified. • Multiple imputation followed by a rank-based analysis is robust and efficient. We recommend MI WL, especially for proof-of-concept clinical trials in a variety of therapeutic areas. • LOCF and “worst rank” single imputation methods are (unfortunately) popular, but inefficient! • REML: no imputation is required, but analysis is inefficient with non-normal and censored data. • SAS macro is available upon request. 2007 ICSA Applied Statistics Symposium
Motiviating Trial #2: ACTG A5197Therapeutic POC Efficacy Trial • Proposed analysis in Statistical Analysis Plan: Untied Worst Rank • Assign VLS = 10^10 – tlast to all “drop-outs”, where tlast = time of dropout (penalizes earlier dropouts). • Use Wilcoxon Rank Sum (WRS) test. • No comments on analysis from CBER. • Analysis targeted to be performed later this year. 2007 ICSA Applied Statistics Symposium
Motiviating Trial #1:Prophylactic POC Efficacy Trial • Proposed analysis in Statistical Analysis Plan:MI WRS • Create M (= 20) complete data sets using SAS PROC MI to impute. • Calculate the numerator and denominator of Wilcoxon rank sum test for each complete data set. • Combine the M results to get a single p-value for inference. • CBER accepted the proposed strategy for the primary analysis! • Requested a sensitivity analysis using the Worst Rank method: subjects who initiate ART considered “failures”. • First interim analysis targeted to be performed later this year. 2007 ICSA Applied Statistics Symposium
References [1] Emini E and Koff W (2004). Developing an AIDS Vaccine: Need, Uncertainty, Hope, Science, 304, 1913-1914. [2] Demirtas, H (2004). Assessment of Relative Improvement Due to Weights Within Generalized Estimating Equations Framework for Incomplete Clinical Trials Data, Journal of Biopharmaceutical Statistics, 14, 1085-1098. [3] Hogan et al. (2004). Handling drop-out in longitudinal studies, Statistics in Medicine, 23, 1455-1497. [4] Johnston M and Fauci AS (2007). An HIV Vaccine – Evolving Concepts, New England Journal of Medicine, 356, 2073-2081. [5] Liang and Zeger (1986). Longitudinal data analysis using generalized linear models, Biometrika, 73, 13-22. [6] Preisser et al. (2002). Performance of weighted estimating equations for longitudinal binary data with drop-outs missing at random, Statistics in Medicine, 21, 3035-3054. [7] Mogg R and Mehrotra DV (2007). Analysis of antiretroviral immunotherapy trials with potentially non-normal and incomplete longitudinal data, Statistics in Medicine, 26, 484-497. [8] Robins et al. (1995). Analysis of Semiparametric Regression Models for Repeated Outcomes in the Presence of Missing Data, Journal of the American Statistical Association, 90, 106-121. [9] Rubin, DB (1987). Multiple Imputation for Non-Response in Surveys, New York: John Wiley and Sons Inc. [10] Thall, PF and Lachin, JM (1988). Analysis of recurrent events: nonparametric methods for random interval count data, Journal of the American Statistical Association, 83, 339-347. [11] Wei, LJ and Lachin, JM (1984). Two-sample Asymptotically Distribution-Free Tests for Incomplete Multivariate Observations, Journal of the American Statistical Association, 79, 653-661. 2007 ICSA Applied Statistics Symposium