Data Analysis Issues in Clinical Trials
690 likes | 850 Vues
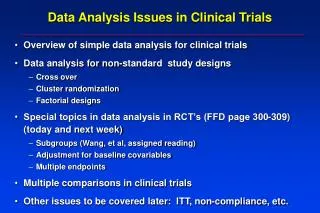
Data Analysis Issues in Clinical Trials. Overview of simple data analysis for clinical trials Data analysis for non-standard study designs Cross over Cluster randomization Factorial designs Special topics in data analysis in RCT’s (FFD page 300-309) (today and next week)

Data Analysis Issues in Clinical Trials
E N D
Presentation Transcript
Data Analysis Issues in Clinical Trials • Overview of simple data analysis for clinical trials • Data analysis for non-standard study designs • Cross over • Cluster randomization • Factorial designs • Special topics in data analysis in RCT’s (FFD page 300-309) (today and next week) • Subgroups (Wang, et al, assigned reading) • Adjustment for baseline covariables • Multiple endpoints • Multiple comparisons in clinical trials • Other issues to be covered later: ITT, non-compliance, etc.
Overview of data analysis for clinical trials • Example: 2 treatment groups (active/placebo) • Goal: compare something in active vs. placebo • What is appropriate analysis? • Analysis depends on type of outcome variable • Continuous (eg. cholesterol level, BP) • Binary (y/n) (eg. death yes/no) • Binary, time to event (eg. time to prostate cancer)
Analysis of 2 group clinical trials • Depends on type of outcome variable • Continuous (t-test) • Binary (y/n) (chi-squared) • Binary, time to event (log rank)
Continuous Outcomes: Analysis • Compare mean in placebo with mean in active • e.g., effect of statins on lipids, b-blocker on BP • Usually compare mean change across two groups • Increased power • Valid to compare “after” only • Other examples: • Change in menopausal symptoms score • Change in weight (RCT’s of diets) • Change in bone density
PTH and Alendronate (PaTH)*:Study Design • P-M women, 55-85 years • Randomize (1 year, double blind) to: • PTH alone (119) • PTH + Alendronate (59) • Others • Endpoints • Change in bone density (%) • Markers of bone remodeling * Black, et. al. NEJM (9/23/03)
Changes in Trabecular Spine Bone Density in PaTH 40 ** ** p<.01 by t-test 30 Mean Change (%) 20 10 0 Spine BMD PTH PTH/ALN * Black, et. al. NEJM (9/23/03)
Little Known Facts about Boring Tests:Who is “Student”? • Student’s t-test • Developed by W.S. Gossett ("Student”) [1876-1937] • Developed as statistical method to solve problems stemming from his employment in...?? • A brewery • Quiz 1: Which brewery did “Student” work for? • Ans: Guinness
When is a T-test Valid? • If the outcome variable is normally distributed, use a t-test. If the outcome is not normal, use a nonparametric test such as a Wilcoxin test. • True or False? Ans: False T-test is valid even when variables are somewhat non-normal
When is t-test Valid • t-test requires that sample means (not individuals) are normally distributed. • What does CLT stand for? • Central Limit Theorem • The mean from any variable becomes normally distributed as n becomes larger (goes to infinity) • Practical implication:t-testalmost always valid for continuous data as long as n is large enough or variable not too weird.
Analysis of trials with continuous outcomes:Badly behaved outcomes • Use t-test usually • If radically non-normal, use non-parametric analogue • Examples • 1. cigarettes per day • 2. Days of back pain
Change in Markers of Bone Turnover with PTH therapy in PaTH(% change) For strong departures from normality, use non-parametric techniques 80 60 Frequency (%) 40 20 0 -90 0 90 180 270 360 450 540 630 1 Year Change (%)
% Changes in Markers of Bone Turnover(Use medians and interquartile range, Wilcoxin test) 75th percentile: +400% 400 Formation (P1NP) 300 200 Median Change (%) Median (150%) 100 25th percentile (25%) 0 -100 0 3 6 9 12 Month (Increases as high as 800%) PTH PTH/ALN
Analysis of trials with binary outcomes • Compare proportion in placebo vs. active groups • e.g., occurrence of vertebral fracture on baseline vs. follow-up x-ray (yes/no, don’t know date) • Measure of association is relative risk • (Risk in active / Risk in placebo) • Use a chi-square test in simple case
3 Years of Raloxifene in MORE: Effect on Vertebral Fracture* Relative Risk (RR)=0.65 (0.53, 0.79) P=?? p<.01 *Vertebral fractures assessed from x-rays at end of trial vs. bl % with fracture PBO RLX 60
Analysis of trials with time-to-event outcomes • Compare survival curves in active vs. placebo groups • Measure of association is the Relative Hazard (RH) or Hazard Ratio (HR) • Similar to Relative Risk • Use log rank test • Stratified chi-square at each “failure” time • Equivalent to proportional hazards model with single binary predictor (hazard ratio)
Women’s Health Initiative (HRT vs PBO): Coronary Heart Disease years1 2 3 4 5 6 7
WHI E + P: Coronary Heart Disease years1 2 3 4 5 6 7
Raloxifene and Risk of Breast Cancer (MORE trial) 1.25 Placebo 3.8 per 1,000 1.00 0.75 p < 0.001 (log rank test) % of participants 0.50 Raloxifene 1.7 per 1,000 0.25 0.00 0 1 2 3 4 Years
Data Analysis for More Exotic RCT Designs • Cluster randomization designs • Factorial designs • Repeated measures design • Cross-over designs
Cluster randomization: Data analysis • Cluster randomization designs • Randomize/analyze clusters • Example • Collaborative Care for Pain for section last week • Randomize Medical Practices (clusters) • Interesting and underutilized design • Popular in this course!
Cluster randomization: JAMA study • 46 clinicians • 401 patients
Cluster randomization of Clinicians ~10 patients ~10 patients ~10 patients ~10 patients ~10 patients ~10 patients 46 clinicians, 401 patients ~10 patients ~10 patients 100 kids
Cluster randomization of Clinicians ~10 patients ~10 patients ~10 patients ~10 patients 100 kids ~10 patients ~10 patients ~10 patients ~10 patients 46 clinicians, 401 patients
Cluster randomization: Analysis • Analysis must account for randomization of clusters, not individuals • Most commonly used technique: Generalized Estimating Equations (GEE) • Type of multiple regression • In Stata and SAS • Effective sample size is between total n and number of clusters
Cluster randomization: Sample size 1. Calculate sample size as if total n 2. Inflation factor: = (1 + (CS-1)*RHO) Where : CS=cluster size RHO=Intraclass corr. coef. CS RHOInflation 30 .05 x 1.5 100 .05 x 6 1000 .05 x 51 eg. if n=100 with no clusters 150 600 51,000
Cluster randomization: Sample size How big is intraclass correlation (rho)? - Degree of similarity within cluster. Corr. Coefficient within cluster (0=no relationship to 1) -In Collaborative Pain Study in section, assumed rho=.05 for sample size -Some empiric studies suggest: in range of .01 to .2 for clusters like medical practice or community - Need pilot data--Challenge in planning a cluster randomization study
Some References for Cluster Randomization Designs • Eldridge, S. M., D. Ashby, et al. (2004). "Lessons for cluster randomized trials in the twenty-first century: a systematic review of trials in primary care." Clin Trials 1(1): 80-90. • Gulliford, M. C., O. C. Ukoumunne, et al. (1999). "Components of variance and intraclass correlations for the design of community-based surveys and intervention studies: data from the Health Survey for England 1994." Am J Epidemiol 149(9): 876-83. • Smeeth, L. and E. S. Ng (2002). "Intraclass correlation coefficients for cluster randomized trials in primary care: data from the MRC Trial of the Assessment and Management of Older People in the Community." Control Clin Trials 23(4): 409-21.
Factorial design: Analysis Implications • Factorial designs • Seductive but tricky • Need to believe and show that no interaction between treatments (statistical test) • Examples: • Vitamin C and E on prostate cancer (Gaziano) • About 15,000 men • 4 treatment groups (all combos) • Selenium and Vitamin E (SELECT, Lippman)
Factorial design: Physicians Health Study II Vitamin C and E and Prostate Ca. (JAMA, 1/7/09) From Figure 1 from Gaziano et al Vitamin E + C Vitamin C alone Vitamin E alone Placebos only
Factorial design: Physicians Health Study II Vitamin C and E and Prostate Ca. (JAMA, 1/7/09) Vitamin C No Yes Placebo N=3653 Vitamin C alone N=3673 N=7326 No Vitamin E Vitamin C + Vitamin E n=3656 Vitamin E alone N=3659 N=7315 Yes N=7312 N=7329
Factorial design: Physicians Health Study II Vitamin C and E and Prostate Ca. (JAMA, 1/7/09) Vs. Vitamin C No Yes Placebo N=3653 Vitamin C alone N=3673 N=7326 No Vitamin E Vitamin C + Vitamin E n=3656 Vitamin E alone N=3659 N=7315 Yes N=7312 N=7329 Vs.
Factorial design: Physicians Health Study II Vitamin C and E and Prostate Ca. (JAMA, 1/7/09)
Physicians Health Study II: Results Vs. Vitamin C No Yes Placebo N=3653 Vitamin C alone N=3673 N=7326 9.3/1000 No Vitamin E Vitamin C + Vitamin E n=3656 Vitamin E alone N=3659 N=7315 9.5/1000 Yes HR=.97 (.85, 1.09) N=7312 N=7329 Vs.
Factorial design: No interaction between treatments Vitamin C No Yes 40% reduction for Vitamin C 10% 6% No Vitamin E Yes 40% reduction for vitamin C 8% 4.8% 20% reduction for Vitamin E 20% reduction for Vitamin E
Factorial design: Interaction between treatments Vitamin C No Yes 40% reduction for Vitamin C 10% 6% No Vitamin E Yes 20% increase for vitamin C 8% 4.8% 10% 20% reduction for Vitamin E 40% increase for Vitamin E
Factorial design: Interaction between treatments Vitamin C No Yes 40% reduction for Vitamin C 10% 6% No Vitamin E Yes 90% increase for vitamin C 8% 4.8% 1% 20% reduction for Vitamin E 80% increase for Vitamin E
Factorial design: Analysis Implications • May be able to analyze by collapsing groups..nice gains in power • In prostate cancer paper end of results: • “we examined 2 way interactions between vitamin C and E and found no interaction” • Effect of vitamin C was the same regardless of whether or not they received vitamin E • Effect of vitamin E was the same regardless of whether or not they received vitamin C • Caution: test of interaction may be very low power
Factorial design: SELECT study (Selenium and Vitamin E Trial) (Lippman) (JAMA, 1/7/09) Selenium alone Vitamin E alone Vitamin E + Selenium placebos
Factorial design: SELECT study (Lippman) (JAMA, 1/7/09) Selenium No Yes 5 hypotheses each tested at 0.005 (one sided). Why not .05? Placebo Selenium alone No Vitamin E Selenium + Vitamin E Vitamin E alone Yes To adjust for multiple comparisons
Factorial Designs: Data Analysis Summary • Factorial design must be taken into account in analysis • Many different approaches but should be thought out in advance • Tests for interactions have low power and may negate some advantages of factorial design
Repeated measures designs • Repeated measures analyses • When outcome is repeated • Continuous: several measurements (at different times during follow-up) • Dichotomous: more than one occurrence of event • Special repeated measures analysis techniques • Example: • A study of effects of estrogen on Carotid In. Wall Thickness (CIMT) (KEEPS) • CIMT to be collected at baseline, 1, 2 and 3 years • Use repeated measures: HT on CIMT using all measurements • Need to make some assumptions about shape of relationship but gain power compared to baseline vs. 3 years only
Cross Over Designs: Analysis Implications • Cross-over designs • Subject is own control • Example: paroxetine and menopausal symptoms • Good design when within-person variation is small • Interpretation requires (mild) assumptions • 1. No effect of order to treatments: a then b is same as b then a • 2. No carryover effect (need long enough wash out period) • Can test for effect of order via model with interaction but large sample size required • Model: • treatment • order of treatments • treatment by order interaction
Advanced Topics in Data Analysis for Clinical Trials • Subgroups • Adjustment for baseline covariables (later) • Multiple endpoints • Analysis of adverse events • Interim analysis Multiple Comparisons A digression….
Multiple comparisons • The general problem • Each statistical test has a 5% chance of Type I error • We are wrong 1 time out of 20 • Easy to come up with spurious results • Take a worthless drug (placebo 2) compare to placebo 1 • 1 study: P(type I error)= 5% • 2 studies: P(1 or 2 type I errors)= almost 10% • 20 studies: P(at least one significant)=64% • Publication bias • (Huge problem in genomic studies)
Multiple comparisons: solutions? • Bonferroni • Divide overall p-value by number of tests • Unacceptable losses of power • Use common sense/Bayesian • Does result make sense? • Biologic plausibility • Is result supported by previous data? • Was analysis defined apriori? • Special solutions for special situations • Multiple comparison procedures for 3 treatment groups • Interim analysis (later lecture)
Advanced Topics in Data Analysis for Clinical Trials • Subgroups • Adjustment for baseline covariables (later) • Multiple endpoints • Analysis of adverse events • Interim analysis
Subgroups • After primary analysis, often want to look at subgroups • Does effectiveness vary by subgroup • If drug effective, is it more effective in some populations? • If results overall show no effect, does drug work in subgroup of participants? • Are adverse effects concentrated in some subgroups?
Levels of subgroups (from FFD) 1. Those specified in study protocol have highest validity Especially if number is small 2. Those implied by study protocol eg. If randomization stratified by age, sex or disease stage 3. Subgroups suggested by other trials 4. (Weakest) Subgroups suggested by the data themselves (“fishing” or “data dredging”) 5. (Diastrous) Subgroups based on post-randomization variables