Download
1 / 4
40 likes | 178 Vues
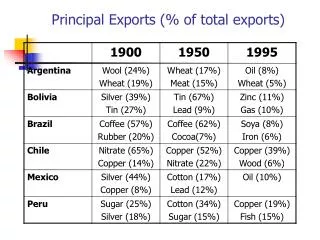
Principal Exports (% of total exports). Per Capita Income Growth, Annual Rate (%). Spain 21 27 Argentina 34 40 Uruguay 37 46 Poland 38 49 Chile 39 48 Costa Rica 41 47 Mexico 51 51 Panama 52 67 Russia 55 55 Venezuela 61 71 Colombia 62 68. Brazil 69 57 Philippines 70 91 Peru 73 81

E N D
Spain 21 27 Argentina 34 40 Uruguay 37 46 Poland 38 49 Chile 39 48 Costa Rica 41 47 Mexico 51 51 Panama 52 67 Russia 55 55 Venezuela 61 71 Colombia 62 68 Brazil 69 57 Philippines 70 91 Peru 73 81 Paraguay 80 85 Ecuador 84 103 China 87 94 ElSalvador 95 86 Bolivia 104 111 Egypt 105 97 Nicaragua106 113 Ranks: Human Development Index and GDP Per Capita
Latin American Growth and Setbacks: Recurrent Themes • Export – led growth: primary product • Dependence on “center” • Debt – financed growth • Debt – crisis • Populism • Inflation – Overvaluation • Stabilization crisis – Austerity