Download

1 / 37
370 likes | 506 Vues
Choosing a Load Balancing Scheme for Agent-Based Digital Libraries. Christos Georgousopoulos and Omer Rana o.f.rana@cs.cardiff.ac.uk Cardiff University and Welsh e-Science Centre http://www.cs.cf.ac.uk/ http://www.wesc.ac.uk/.

E N D
Choosing a Load Balancing Scheme for Agent-Based Digital Libraries Christos Georgousopoulos and Omer Rana o.f.rana@cs.cardiff.ac.uk Cardiff University and Welsh e-Science Centre http://www.cs.cf.ac.uk/ http://www.wesc.ac.uk/ Joint Project: Giovanni Aloisio, Masimo Caffaro (University of Lecce, Italy) and Roy Williams (CACR, Caltech, US)
Earth Observation System Tapes Metadata Acquisition Archiving Processing Dissemination Final Users DLR ESA NASA ASI Space Agencies
user UIA: User Interface Agent URA:User Request Agent UPA:User Presentation Agent UIA system architecture URA UPA LIA LIA LSA LAA LMA LIGA LRA LSA LRA LAA LMA LIGA GIS Data Archive LIA: Local Interface Agent LIGA: Local InteGration Agent LAA:Local Assistant Agent LRA: Local Retrieval Agent LMA:Local Management Agent LSA: Local Security Agent
Applications: Post-Fire Measurements SAR measurements of fire-affected regions can aid in monitoring forest regrowth after a fire SIR-C/X-SAR L-band images of Yellowstone National Park, Wyoming obtained in 1994, six years following a major fire in 1988. map of the forest crown showing its biomass color scale: blue (rivers and lakes with no biomass) brown (non-forest areas with crown biomass of less than 4 tons/ha) light brown (areas of canopy burn with biomass of between 4-12 tons/ha) yellow (areas with a biomass of 20-35 tons/ha) green (forest with a biomass of greater than 35 ton/ha)
Applications: Archeology Lost city of Ubar Arabian Peninsula Remote desert caravan oupost 2800 B.C.-300 A.D.
Web Browser Java Applet GUI Localhost Mobile agents for data retrieving 10 1 2 UPA 9 URA 3 URA URA LSA LAA LRA URA URA URA SIR-C Imaging radar in USA LSA LAA LRA 4 6 5 ERS-1 Data in Italy 7 8
Load Balancing Context • Multiple Information Servers available • Offer similar capability • Host “Management Agents” • How much intelligence in mobile vs. stationary agents? • To which server should we send the mobile agent?
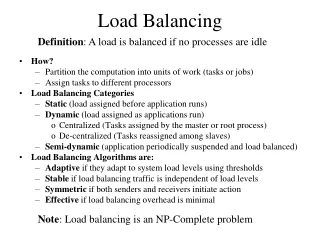
Load Balancing Aim: improve the average utilization and performance of tasks on available servers Must consider: (1) Number of agents/server; (2) Number of tasks/agent Kinds of Load Balance (LB): Load balance Keren & Barak: mobile LB has a 30-40% improvement over the static placement scheme mobile static model state • only a price • sophisticated auction protocols • a pricing mechanism without • any negotiation Market mechanism Specialized agents gather System state information • roam through the network • bid for resources
State-based vs. Model-based Approaches • State based • Gather system state (how much, how frequently) • Use this to make mapping decisions (eg. Spawn, Dynast, OCEAN) – market based (montoring – eg Mats, Traveler) FLASH – a single (centralized) monitor that passes info to nodes • Model based • Attempt to predict system state – via a “model” • Use outcome of model as a means to make a mapping decision (eg. Enterprise, Challenger (machine learning-based), etc)
Gathering System State • Roaming/Scout agents • Agents look for free resources • Report this back to nodes • For “N” servers, requires “N-1” serialization and migrations • Management agents • Specialist agents capture system state • N *(N-1) message exchanges • Reduce who to exchange state information with • “Direct Neighbour” vs. “All Neighbour” policy
Configuration Options • 100Mb/s network, 5 servers • Local state info: 150 to 200 bytes • Number of active agents, utilization, resources available • Initial agent size: 2.8KB (Voyager ORB) • Message exchange time: 21ms to 36ms • Agent serialization time: 31ms to 47ms • Migration time (+ time to store local state info): 564ms to 678ms • Create reference to a proxy: 93ms to 125ms
Efficiency Trade-off • Each migration leads to potentially (N-1) messages: • (N-1) migration * (N-1) messages • For N=44 roaming agent approach becomes more efficient 4 3 2 1 1
Our approach on LB • Provide a LB mechanism to evenly distribute agent tasks among the available servers (i.e. equitably server the agents, there are no priorities between agents based on the time needed for their task to be accomplished) • We propose a LB mechanism based on a combination of the model-based and state-based approaches (i.e. decisions on LB are based upon a model which adapts due to the information gathered from the state-based approach) • We demonstrate this approach for a MAS operating on an active digital library composed of multi-spectral images of the Earth as part of the Synthetic Aperture Radar Atlas (SARA)
The SARA LBmechanism • State-based approach (1/4) The management agents in the SARA architecture (2/4) Distribution of information among the management agents (3/4) Information maintained by management agents (4/4)Communication between management agents • Model-based approach (1/1)LB decision model Delegate Load Balance Decision to the Management Agent (2 messages exchanges between mobile and management agent)
Advantages of the proposed LB technique • More accurate LB decisions • LB decisions are supported by the management agents (LB model uses the state-based information) • Distribution of information between the management agents (the variation of the global network map decentralizedinformation distribution implies reduction of information replication)
(1/4) The management agents in the SARA architecture (state-based approach) (state-based approach) • A management agent exists for every server • Their common objective: optimize system performance web server UMA (Universal Management Agent) i) optimize mobile agents’ itinerary ii) avoid unnecessary migrations iii) identification & comparison of agent task Info. server LMA (Local Management Agent) i) inform mobile agents for updates • Why multiple management agents ? i) no central point of failure ii) over a centralized scheme: as the number of agents increase, the network load is increased • LB decisions are supported through the management agents
Advantages of having management agents control over LB decisions Advantages of having management agents control over LB decisions • Minimization of information transmitted over the network (i.e. only 2 messages are exchanged between a mobile agent and a management agent: the agent’s requirements & the agent’s itinerary ) • Minimization of the mobile agent’s size (i.e. the decision support algorithm is within the management agents. Alternatively mobile agents would have to carry it during their migration) • System optimization Information used for LB decisions may also be reused for: i) undertaking similarity analysis between agent requests i.e. tasks ii) cache techniques are possible to be applied iii) lay the foundations for an efficient monitoring system
(2/4) Distribution of information among the management agents (2/4) Distribution of information among the management agents (state-based approach) (state-based approach) • centralized scheme :a global database is used to hold all information for each server • agent interactions stored in one location • information: network overload increases • in a case of a failure • distributed scheme :information is distributed among the servers no central point of failure i) global network map • each server has all the information: replication (for integrity) (provides all information for each server) network overload decreases ii) map of the surrounding area (provides information for the local server but information is reduced more and more for servers which are not in the local region) • impose agents to have a kind of intelligence iii) neighbor map (provides information for the local server and its neighbor servers only)
(3/4) Information maintained by management agents (state-based approach) (state-based approach)
(4/4) Communication between management agents (state-based approach)
LB decision model LB decision model (model-based approach) (model-based approach) • LB decisions are based on a model which accepts as: input: an agent’s requirements & System state information output: the appropriate server where an agent should migrate to • The model is a function of: i) agents’ tasks ii) servers’ utilization (performance load) iii) availability of resources iv) network efficiency
Dynamic Approach – Track Selection by polygon The user is allowed to select a polygonal area on a zoomable map of the world The algorithm retrieves all the tracks intersecting the user’s polygon in at least one point
Load Balancing (model-based approach) (model-based approach) The model may be better expressed with reference to the agents’ task…
Load Balancing (Model-based Approach) examples of different agents’ tasks… case 3: Agent’s task Similar (cached) Exactly the same Need filtering Custom filter case 5: Agent’s task Not similar (not cached) Do not need filtering +Ts where: Tav = the average time an agent needs to complete a task (regarding all servers) Uav = the average utilization of all servers Us = the utilization of a server Sa.code= the file-size of an agent’s code. B2 = the bandwidth between 2 information servers Τs = time needed for a server to became available utilization of a server where: a = the number of agents on that server μ = the average task time of the agents L = the processing power of the server
Details of experiments conducted: • 200 agents launched • 5 information-servers & 1 web-server • (Sun-Ultra 5 workstation running on Solaris 8 • with Voyager 4.5 as the agent platform) • 100Mbits/s network connection • data-repository maintained by Oracle 9 DBMS Workload distribution – utilisation of Information-servers on the execution of agents with simple tasks on the execution of agents with mixed tasks (15% where complex task)
adaptability algorithm Scheme No.1: represents the default LB scheme adopted in SARA MAS (lifetime of complex agent tasks is known) Scheme No.2: alternative version of No.1 (lifetime of complex agent tasks is unknown and therefore not used in calculations) Scheme No.3: alternative version of No.2 (adaptable algorithm is utilised for amending the server’s utilisation) Adaptability of model For other systems utilising active-archives in which the lifetime of complex tasks cannot be estimated or tend to be erroneous Three different LB schemes:
Comparison of different LB schemes Total task time required by agents to complete their task Efficiency between LB scheme No.2 & No.3 Optimisation of LB scheme No.2, based on the utilisation of the adaptability algorithm optimisation in performance 1.63 – 10.8 %
Conclusion – Future work • we demonstrated a combination of the state and model-based approaches for mobile agent load balancing were specializedstationary agentsare used togather system state informationandmake decisions on the distribution of mobile agents among the servers, based on amodelofprobabilistic estimationsin relation with the informationprovided by the stationary agents • we have implement the proposed LB technique • … need to further optimize the intelligence of the management agents
Load Balancing Load balancing overview Load balancing overview Aim: improve the average utilization and performance of tasks on available servers Kinds of Load Balance (LB): Load balance Keren & Barak: mobile LB has a 30-40% improvement over the static placement scheme mobile static model state • only a price • sophistiated auction protocols • a pricing mechanism without • any negotiation Market mechanism Specialized agents gather System state information • roam through the network • bid for resources
Load Balancing Our approach on LB Our approach on LB • Provide a LB mechanism to evenly distribute agent tasks among the available servers (i.e. equitably serve the agents, there are no priorities between agents based on the time needed for their task to be accomplished) • We propose a LB mechanism based on a combination of the model-based and state-based approaches (i.e. decisions on LB are based upon a model which adapts due to the information gathered from the state-based approach) • We demonstrate this approach for a MAS operating on an active digital library composed of multi-spectral images of the Earth as part of the Synthetic Aperture Radar Atlas (SARA)
Load Balancing The SARA LB mechanism The SARA LB mechanism • State-based approach (1/4) The management agents in the SARA architecture (2/4) Distribution of information among the management agents (3/4) Information maintained by management agents (4/4) Communication between management agents • Model-based approach (1/1)LB decision model
Load Balancing The SARA architecture The SARA architecture
Load Balancing (1/4) The management agents in the SARA architecture (1/4) The management agents in the SARA architecture (state-based approach) (state-based approach) • A management agent exists for every server • Their common objective: optimize system performance web server UMA (Universal Management Agent) i) optimize mobile agents’ itinerary ii) avoid unnecessary migrations iii) identification & comparison of agent task Info. server LMA (Local Management Agent) i) inform mobile agents for updates • Why multiple management agents ? i) no central point of failure ii) over a centralized scheme: as the number of agents increase, the network load is increased • LB decisions are supported through the management agents