Download
1 / 12
120 likes | 231 Vues
In this lesson, we will review important concepts related to piecewise and absolute value functions, including how to solve, graph, and express them in interval notation. We will define the domain of functions, illustrate how to create pieces of a piecewise function, and analyze absolute value functions that always yield non-negative outputs. Students will participate in graphing exercises that will reinforce their understanding of these topics, culminating in homework assignments designed to solidify the knowledge acquired.

E N D
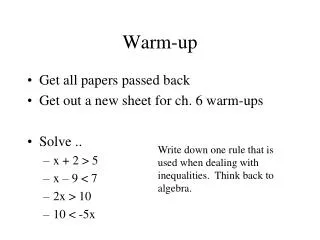
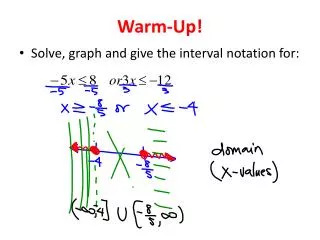
Warm-Up! • Solve, graph and give the interval notation for:
Algebra II – 2.6 Piecewise and Absolute Value Functions
To Review: • Domain – the values of the X-coordinates needs to be found: • An interval is: • A piecewise function is drawn according to:
Let’s Graph the following: 2 if f(x) = x + 4 if -½x if
Absolute Value Functions: • Remember that Absolute Value must always be • Therefore, the graph will always appear • No matter what value the X is, the Y will be
Let’s Graph: First – set the value inside of the absolute value bars equal to zero Now that we have that X value where the graph is at its lowest point, we can find three greater and three less than that point Using a table –
Homework: Page 93 (8-11) Page 94 (31-41 odd) and 44