SeaWinds Beam Illumination Patterns and Ocean Surface Measurements
80 likes | 98 Vues
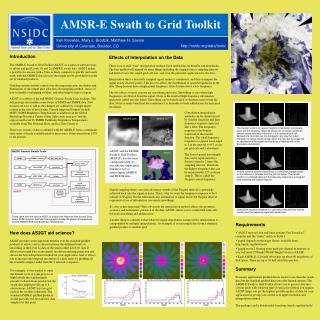
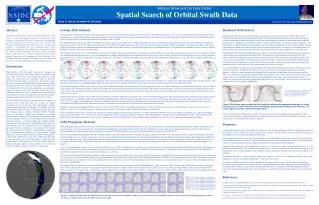
This study focuses on the analysis of SeaWinds radar imagery, including the beam illumination patterns, ground track velocity vector, and subsatellite track, to obtain accurate measurements of the ocean surface. The results are showcased through enhanced resolution grid illustrations and comparisons of different reconstruction types. Several example images from polar regions and land regions are provided.

SeaWinds Beam Illumination Patterns and Ocean Surface Measurements
E N D
Presentation Transcript
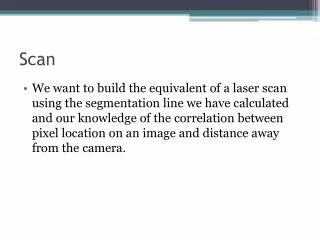
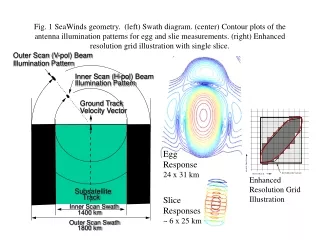
Outer Scan (V-pol) Beam Illumination Pattern Inner Scan (H-pol) Beam Illumination Pattern Ground Track Velocity Vector Subsatellite Track Inner Scan Swath 1400 km Outer Scan Swath 1800 km Fig. 1 SeaWinds geometry. (left) Swath diagram. (center) Contour plots of the antenna illumination patterns for egg and slie measurements. (right) Enhanced resolution grid illustration with single slice. Egg Response 24 x 31 km Enhanced Resolution Grid Illustration Slice Responses ~ 6 x 25 km
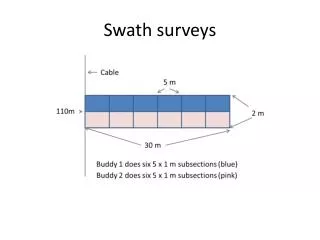
Fig. 2. Overlap of QuikScat slices for (top) a few consecutive pulses during a single antenna rotation and (lower) several antenna rotations
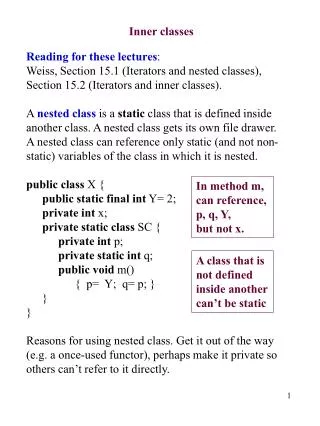
Fig. 3. SIR algorithm Simulation results. (a) Synthetic true image. (b) “drop in the bucket” grid image [non image] from eggs. (c) SIR image from egg measurements. (d) Grid image from slices [non image]. (e) SIR image from slices. True Slice Gridded Egg Gridded Slice SIR Egg SIR
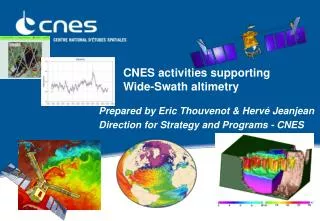
-30 dB 0 dB A Fig. 4. Examples of polar region A images. These images have been ice masked. Arc (.imsk) Ant (.imsk) H-pol
-30 dB 0 dB A Fig. 5. Examples of QuikScat enhanced resolution land regions.All images have been land masked. Red boxes are shown in greater detail in later figures. all (.lmsk) Sib Ala Grn ChJ NAm Eur SAs CAm NAf Ind SAf SAm Aus JD300-303 2000 V-pol
Fig. 6. Egg-based SIR enhanced-resolution image example. Naf (.lmsk) 4.45 km nominal pixel spacing -30 dB 0 dB A Full egg image is 2120 x 1130 pixels for this region V-pol
Fig. 7. Resolution comparison of various reconstruction types. .ave .non .sir .sir Slice AVE Slice SIR Gridded (non) Egg SIR NAm (.lmsk) -30 dB 0 dB A H-pol: -32 to 0 dB
Fig. 8. Example ancillary products P Time V A std J ave inc C count H-pol NAm(.lmsk)