Download
1 / 21
210 likes | 357 Vues
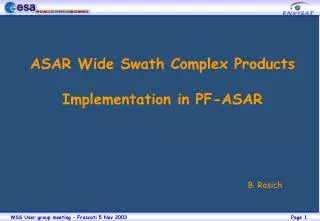
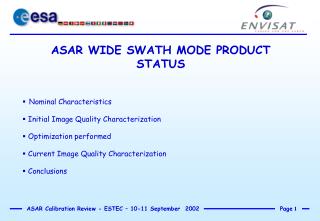
ASAR WIDE SWATH MODE PRODUCT STATUS. Nominal Characteristics Initial Image Quality Characterization Optimization performed Current Image Quality Characterization Conclusions. Ground range projected detected products Nominal resolution < 150 m Swath width: 406 Km Pixel spacing 75 m

E N D
ASAR WIDE SWATH MODE PRODUCT STATUS • Nominal Characteristics • Initial Image Quality Characterization • Optimization performed • Current Image Quality Characterization • Conclusions
Ground range projected detected products Nominal resolution < 150 m Swath width: 406 Km Pixel spacing 75 m ENL > 12 for all the different subswaths Antenna pattern and range spreading loss correction applied Data output as unsigned 16 bit Systematic stripline processing: products as long as the complete acquisition segment Product size: multiple of granule interval (4 seconds) WSM PRODUCT CHARACTERISTICS
WSMproduct acquired 18 March over the Larsen Peninsula FIRST WSM IMAGE
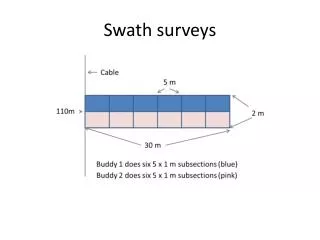
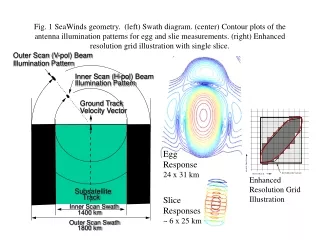
Only one acquisition available over the ESA transponders (on SS3 and SS4) and multiple rainforest acquisitions in VV polarization INITIAL QUALITY MEASUREMENTS
IRF quality measured on trasponders in SS3-SS4 Range Resolution: 155160 m [150 m] Azimuth Resolution: 98 115 m [150 m] PSLR rg: -21.4 -19.3 [-20 dB] PSLR az: -11.7 -10 [-20 dB] ISLR: -12 -10 dB [-12 dB] ENL [>2.17] IRF QUALITY RESULTS 7,5 SS1 7,6 SS2 7,5 SS3 5,5 SS4 5,4 SS5
Optimizing (which) quality ? > = 100 combinations !
Parameters subject to optimization Processing parameters Range look: number, bandwidth and overlap [Burst shaping window] [Range look window shape] System parameters [Scan cycle] Transmitted bandwidth Some parameters have already been set at their optimal values. Most parameters are decoupled, and optimization is trivial. The transmitted bandwidth is the most critical to be tuned, due to its contrasting effects on the quality figures ENL vs CNR
The impact of bandwidth on quality measures + the many different requirements and operative conditions discourage searching for closed form optimizations/inversions. The optimization is carried out by modelling the end-to-end ScanSAR acquistion & processing and coding into a worksheet for comprehensive quality check. Bandwidth Optimization
The bandwith optimization provided a better exploitation of the system resources and a fine tuning of performances. Bandwidth Optimization Before (SS1) After (SS1)
IRF quality measured on trasponders in SS5 Measured expected constraint Range Resolution: < 130 m 130 140 [150 m] Azimuth Resolution: 95 130 m 95 100 [150 m] PSLR rg: -15 -14.6 [-20 dB] PSLR az: -15 -10 [-20 dB] ISLR: -11 dB [-12 dB] ENL (SS1-SS5) ~ 14 15 16 [>2.17] CNR > 13.4 14.4 16.4 Measures after optimization
mean value 11e6 minimum Nes0 < 0.5e6 CNR > 13.4 dB expected 14.4
DIFFERENT PROCESSING GAINS 1474 1610 1975 2111
DIFFERENT PROCESSING GAINS 1474 1610 1975 2111