General Education and Training
220 likes | 278 Vues
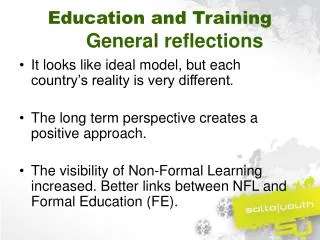
This initiative focuses on improving the quality of education at the primary school level by setting clear targets, monitoring progress, and supporting conducive learning environments in schools serving impoverished communities. The campaign provides directives and expectations to all education stakeholders, emphasizes literacy and numeracy development, and assesses learner performance. Progress includes resource dissemination, standardized assessments, and ongoing support for teachers and schools. The current performance assessment indicates varying levels of educational quality across provinces and districts, highlighting areas for improvement to meet the literacy benchmark.

General Education and Training
E N D
Presentation Transcript
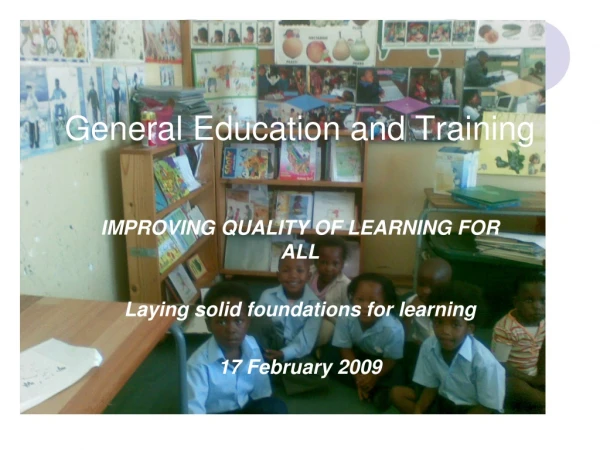
General Education and Training IMPROVING QUALITY OF LEARNING FOR ALL Laying solid foundations for learning 17 February 2009
A Focus on quality at the GET level • Literacy and Numeracy at the center; • Communicate clear expectations to all; • Set clear targets for achievement; • Monitor learner progress; • Support the creation of conducive environments for achieving success in schools serving the poorest communities.
FOUNDATIONS FOR LEARNING CAMPAIGN • Focus is on all schools • Anchored on the provision of clear directives and expectations for quality education at primary school level (to every teacher, every principal and every manager in the system) – not to add new requirements • The campaign is designed to focus attention on key activities that lead to good literacy and numeracy development.
Key focus of update • Mobilisation for broad involvement in campaign after launch on 14 March 2008; • Communication of campaign directives/expectations; • Support to schools and education officials across system; • Assessment of learner performance; • Plans for 2009 (and beyond).
Communicating expectations • Key FFL Documents sent to all schools (April-June 08: • FFL Gazette and teacher/principal letters on expectations: a) basic targets by 2011; b) essential daily to promote necessary skills and competencies; c) basic resources ; d) regular assessment of learner performance. • Assessment Frameworks that set out milestones (knowledge and skills to be taught for each grade and for each term). • Less than 0,5% of the above were returned but evidence that not all schools received documents on time.
Progress to date • In July 2008 the Foundations for Learning learning space was created on the Thutong website and resources uploaded. Reports indicate frequent use by teachers. • In October 2008 the average cost of the resources stipulated in the gazette was made available to all provincial departments and to Curriculum Advisors – to guide procurement of resources for 2009. • The cost was based on an average class size of 40. Most provinces indicate they have used both the gazette and the approximate cost to plan for LTSM provisioning for Grades 1 – 6 in 2009.
Progress to date • Standardised assessments took place as scheduled in November 2008 for all grades 1 – to 6 learners . • 78 tests and memoranda developed by teachers and curriculum advisors in 11 languages (May – October 2008); • Exemplars of assessment tasks were sent to all Curriculum managers; • The tests were administered and marked by grade educators, under supervision of SMT members. • Mark schedules have been scheduled to the DoE for broad analysis.
Focus in 2009 • Advocacy posters on non-negotiables have been printed and are currently being distributed to schools; • 40 weekly lesson plans to provide additional support to teachers who need it are being finalised. (These are a result of direct requests by schools and teachers); the 10 weekly plans for term one will be available from end February 2009; • Quarterly tests for districts to use with their schools have been developed and will be distributed early in March 2009; • A guideline document on the establishment and activities of teacher district forums has been developed and will be made available through popular print, district offices and on the DoE website; • A survey conducted in December to assess additional support required by schools and teachers will be analysed and will inform further activities of the campaign.
CURRENT PERFORMANCE OF SYSTEM IN LITERACY - TOWARDS 50% BENCHMARK
Eastern Cape The province currently below the national level (35% against 36% national score ) District mean scores range from 45% (Engcobo) to 26% (each in Lusikisiki and Qumbu) Distribution of “educational quality” across schools notably uneven, with the highest inequalities in East London, Engcobo and Port Elizabeth; Where there is some “equality”, it tends to be on the lower end of “quality” (cf. Queenstown).
Free State Both province and individual districts functioning above the national level of 36%, - provincial mean score 43% and 39% for the lowest-achiever district (Fezile Dabi). District mean scores are fairly flat, ranging between 44% (Lejweleputswa) and 39% (Fezile Dabi) The quality gap between top- and bottom-performing schools is quite wide and relatively uniform across the districts. Top schools in Lejweleputswa and Motheo perform just above the 50% target.
Gauteng The province functions at 2 percentage points above the national level (38% as against 36%) Average district performance ranges between 47% (Ekurhuleni North) and 28% (Jhb Central) There is considerable variability in the distribution of “educational quality” - the widest being in Ekurhuleni North (top performers at above 70% and bottom performers at 25%) In Sedibeng West performance is low (30%), but difference between top- and bottom- performers almost indistinguishable.
KwaZulu-Natal The province functions at 2 percentage points above the national level (38% as against 36%) Average district performance ranges between 46% (Umlazi) and 29% (Ilembe) Except for Umlazi where there is the largest quality gap between top- and bottom- performers, variability of educational quality is relatively moderate Only top-performers in two districts (Obonjeni and Umlazi) function above the 50% target
Limpopo The province performs noticeably lower than the national level (29% as against 36%) Districts form two categories, the first around 30% (Greater Sekhukhune, Vhembe and Waterberg) and the second around 25% (Capricorn and Mopane) The quality gaps between top- and bottom- performers within districts are fairly large, particularly in Greater Sekhukhune. Both provincial and individual district performances fall far below the 50% target.
Mpumalanga The performance of the province falls 4 percentage points below the national mean (32% as against 36%). The districts can be categorised in two: the first functioning around 35% (Gert Sibande and Nkangala) and the second at around 25% (Bushbuckridge and Ehlanzeni) Within-region quality gaps are widest in Gert Sibande but are also considerably wide in the rest of the regions. Both province and individual regions perform below the 50% benchmark.
Northern Cape The province functions at 2 percentage points below the national level (34% as against 36%) District performance ranges from 40% (Francis Baard and Namaqua) to 31% (Karoo) Except for Francis Baard where there is a sizable gap between top- and bottom- performers, within-district variability is moderate and somewhat evenly distributed across districts Only top performers in Francis Baard function above the 50% benchmark.
Northwest The province functions one percentage point below the national level (35% against 36%) Average district scores range between 44% (Potchefstroom) and 25% (Greater Delarey and Moses Kotane East) The largest within-district quality inequalities were in Klerksdorp and Potchefstroom, otherwise quality gaps in the rest of the districts were moderate to very narrow in some districts Only top-performing schools in Potchefstroom function above the 50% benchmark.
Western Cape The province functions markedly above the national level (48% as against 36%) District performance ranges from 36% (Metro-East) to 53% (Metro-Central). There are moderate within-district “educational quality” gaps in most districts with the exception of Metro-North and Metro-South where inequalities are quite large Three of the districts (Metro-Central, Metro-North and Western Coastlines) are already functioning at or above the 50% benchmark
Supporting schools serving the poorest communities (through QIDS UP) • Affirmative action programme to bring hope (and dignity) to children in schools serving the poorest communities; • Focuses on support through appropriate resources, leadership and teacher capacity - towards improved quality and excellence;
Common problems that persist GRADE R • Overall very little focus (attention) on Grade R: poor classroom environments; inappropriate furniture and learning resources; • State commitment is to quality universal Grade R by 2010 (1 000 learners); • Some amazing progress made in a few provinces (mostly using QIDS UP resourcing) – WCED and Free State with both indoor and outdoor resources; Gauteng focus on ECD practitioner capacity etc. • Unfortunately this not uniform – practice of accommodating Grade R in the poorest class with an untrained teachers prevails.
Common problems that persist Water and sanitation! • Toilets in unacceptable conditions – dirty, unsafe, no toilet paper! • No drinking water! Overcrowding and multi-grade classrooms Classroom environments • Bare walls – even with very detailed breakdown of minimum resources necessary; • scant regard to cleanliness Special Schools