Download
1 / 27
270 likes | 451 Vues
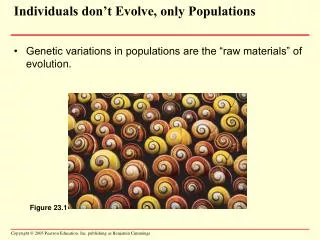
Figure 23.1. Individuals don’t Evolve, only Populations. Genetic variations in populations are the “raw materials” of evolution. Microevolution Is change in the genetic makeup of a population from generation to generation: Is Observable Macroevolution: One species becomes another species

E N D
Figure 23.1 Individuals don’t Evolve, only Populations • Genetic variations in populations are the “raw materials” of evolution.
Microevolution Is change in the genetic makeup of a population from generation to generation: Is Observable • Macroevolution: One species becomes another species • Species: 2 can breed and → offspring that can also breed and produce offspring • The gene pool • Is the total aggregate of genes in a population at any one time • Consists of all gene loci in all individuals of the population
The Hardy-Weinberg Theorem • The Hardy-Weinberg theorem is Hypothetical • Describes a population that is not evolving • States: The frequency of the alleles in a population WILL NOT change. • In other words, if a population is 25% BB, 50% Bb and 25% bb, then over time it will remain the same. This is true only if: • Extremely large population size • No gene flow (immigration or emigration) • No mutations • Random mating • No natural selection • In Nature, we see that the frequencies DO change, therefore one or more of the above 5 conditions must be false.
Hardy-Weinberg Formula p2 + 2pq + q2 = 1 Where: p2 = frequency of BB q2 = frequency of bb 2pq = frequency of Bb And:p + q = 1 Where p = frequency of B q = frequency of b
Practice p2 + 2pq + q2 = 1 Where: p2 = frequency of BB q2 = frequency of bb 2pq = frequency of Bb And:p + q = 1 Where p = frequency of B q = frequency of b 1. In a population with two alleles for a particular locus, B and b, the allele frequency of B is 0.7. What would be the frequency of the heterozygotes if the population were in Hardy-Weinberg equilibrium? frequency of B = p since p + q = 1, q = 2pq = frequency of Bb = = 0.7 0.3 2(0.7 X 0.3) = 0.42
Practice 2. In a population in Hardy-Weinberg equillibrium, 16% of the individuals show the recessive trait. What is the frequency of the dominant allele in the population? • 16% = bb = q2 • q = Square root of .16 = • Since p + q = 1 • p = • p is the frequency of the dominant allele p2 + 2pq + q2 = 1 Where: p2 = frequency of BB q2 = frequency of bb 2pq = frequency of Bb And:p + q = 1 Where p = frequency of B q = frequency of b 0.4 0.6
Population Genetics and Human Health • We can use the Hardy-Weinberg equation • To estimate the percentage of the human population carrying the allele for an inherited disease • PKU is a recessive disease, striking 1 in 10,000. What percentage of the population are carriers? • 1 in 10,000 is the frequency of the recessive allele, or bb = • First, find either p or q (usually q): Square route of 10,000 = • Then, once you have q, find p, given that p + q = • Since q = 0.01, p 1.0 – 0.01 or p = • The carriers are heterozygotes or 2pq • 2 ( 0.99X0.01) = • = approximately 2% of the population are carriers q2 0.01 1 0.99 0.198
X X X X • Concept 23.2: Mutation and sexual recombination produce the variation that makes evolution possible • Two processes, mutation and sexual recombination produce the variation in gene pools that contributes to differences among individuals • Sexual Recombination By: • Crossing over at Prophase 1 • Alignment of homologous chromosomes at Metaphase 1 • Random Fertilization XX X X
Point Mutation causing sickle-cell disease. A point mutation is a change in ONE base in a gene. Can impact phenotype, but is usually harmless.
Base-Pair Substitutions • No effect: both GGC and GGU code for Gly (wobble) • Missense: still codes for an amino acid, but the wrong one • Nonsense: lead to nonfunctional proteins
Insertions and Deletions • Additions or losses that may alter the reading frame (group of 3 bases of the codon). • Are disastrous. The further upstream, the more harmful
How are a population’s genetic combinations altered? • In sexually reproducing populations, sexual recombination Is far more important than mutation in producing the genetic differences that make adaptation possible • Concept 23.3: Natural selection, genetic drift, and gene flow can drastically alter a population’s genetic composition • Three major factors alter allele frequencies and bring about most evolutionary change • Genetic drift: Bottleneck Effect and Founder Effect • Natural selection: Those with positive adaptations live long enough to reproduce • Gene flow: genetic additions or subtractions from a population that reduces genetic differences between populations. For example, a new flower type moves into an area and cross pollinates with the ones already there. What were once separate populations become similar over time.
(a) Shaking just a few marbles through the narrow neck of a bottle is analogous to a drastic reduction in the size of a population after some environmental disaster. By chance, blue marbles are over-represented in the new population and gold marbles are absent. Figure 23.8 A Altering a Population’s genetic composition • Genetic drift: The Loss of alleles to the population by Chance • In the bottleneck effect • A sudden change in the environment may drastically reduce the size of a population • The gene pool may no longer be reflective of the original population’s gene pool
The Founder Effect • The founder effect • Occurs when a few individuals become isolated from a larger population • Can affect allele frequencies in a population
A Closer Look at Natural Selection • From the range of variations available in a population • Natural selection increases the frequencies of certain genotypes, fitting organisms to their environment over generations • Types of Selection in nature: Directional: Light colored mice in Canada are screwed Disruptive: The brown mice living in grasslands are screwed Stabilizing: Human birth weight: very small or very large babies at birth have less chance of survival
Frequencies of the sickle-cell allele 0–2.5% 2.5–5.0% 5.0–7.5% Distribution of malaria caused by Plasmodium falciparum (a protozoan) 7.5–10.0% 10.0–12.5% >12.5% Figure 23.13 Heterozygote Advantage: Preserves genetic variation • Heterozygotes for Sickle-cell (Bb) have resistance to malaria. Frequency-Dependent Selection: The fitness of any morph (form) declines if it becomes too common in the population. When all the moths are brown, the birds that see them well flock in and eat them all.
Sexual reproduction Asexual reproduction Generation 1 Female Female Generation 2 Male Generation 3 Generation 4 Figure 23.16 The Evolutionary Enigma of Sexual Reproduction • Sexual reproduction • Produces fewer reproductive offspring than asexual reproduction, a so-called reproductive handicap. But, it also provides increased variation.
In sexually reproducing populations, what things contribute to changes in allele frequencies (genetic recombination)? • Genetic drift: Bottleneck Effect and Founder Effect • Natural selection: Those with positive adaptations live long enough to reproduce • Gene flow: genetic additions or subtractions from a population that reduces genetic differences between populations. For example, a new flower type moves into an area and cross pollinates with the ones already there. What were once sepaate populations become similar over time. • Sexual Recombination By: • Crossing over at Prophase 1 • Alignment of homologous chromosomes at Metaphase 1 • Random Fertilization
Lab 8: PTH Tasters • Given the data below, determine the frequencies of the AA, Aa, and aa alleles. What, if any H-W condition is NOT being met? • A population of 100 students is tested for their ability to taste PTC, a dominant trait. In the normal population, the frequency of tasters of 0.55, Nontasters is 0.45. The table below shows this data, and that for a segment of the population:
A population of 100 students is tested for their ability to taste PTC, a dominant trait. In the normal population, the frequency of tasters of 0.55, Nontasters is 0.45. The table below shows this data, and that for a segment of the population 0.33 0.67 • Given the data above, determine the frequencies of the AA, Aa, and aa alleles. What, if any H-W condition is NOT being met?
C. Below are 2 Cases of study of H-W. For each Case, determine the gene frequencies of AA, Aa, and aa in the F5 generation. Then determine whether or not they are in H-W equilibrium. Last, propose a reason for your observations. • Case I: The following table shows 5 generations of data for an ideal H-W population consisting of 32 members:
Answer: • The tasters might be AA or Aa, but you can’t tell how many of each there are. The nontasters, however must be aa. So you start with them. • Given the H-W theorem: p2 + 2pq + q2 = 1 • And • p + q = 1 • And starting with what IS known, that q2 = 0.45: • If q2 = 0.45, then q = 0.67. • Since p + q = 1, then p = 0.33. • 2pq = 0.44 • q2 = aa = 0.45 • 2pq = Aa = 0.44 • p2 = AA = 0.11 • The H-W condition that is not met is that this class is not a large population. • What are p and q for the general population? p2 + 2pq + q2 = 1 Where: p2 = frequency of BB q2 = frequency of bb 2pq = frequency of Bb And:p + q = 1 Where p = frequency of B q = frequency of b
Case 1 p2 + 2pq + q2 = 1 Where: p2 = frequency of BB q2 = frequency of bb 2pq = frequency of Bb And:p + q = 1 Where p = frequency of B q = frequency of b • Frequency of AA = 7/32 = • Frequency of aa = 7/32 = • Frequency of Aa = 18/32 = • P2 (AA) = • 2pq (Aa) = • q2 (aa) = • p = 0.5 = Ideally • q = 0.5 = Ideally 0.22 0.22 0.56 0.22 0.56 0.22
Case II: The table below also shows 5 generations of a population of 32: Determine the gene frequencies of AA, Aa, and aa in the F5 generation. Then determine whether or not they are in H-W equilibrium. Last, propose a reason for your observations.
Case 2: • Frequency of AA = 11/32 = 0.34 • Frequency of aa = 0/32 = 0.00 • Frequency of Aa = 21/32 = 0.66 • P2 (AA) = 0.25 • 2pq (Aa) = 0.50 • q2 (aa) = 0.25 • p = 0.5 • q = 0.5 p2 + 2pq + q2 = 1 Where: p2 = frequency of BB q2 = frequency of bb 2pq = frequency of Bb And:p + q = 1 Where p = frequency of B q = frequency of b
Answer: • For Case I, the F5 generation, with a total population was 32, displays the following gene frequencies:: • p2 = AA = • 2pq = Aa = • q2 = Aa = • In Case II, also with 32 members, the following gene frequencies are seen in the F5: • p2 = AA = • 2pq = Aa = • q2 = Aa =
Case I shows H-W equilibrium, given that the overall allele frequencies did not change, even though the population size was small. • Case II is NOT in H-W equilibrium with Case I, assuming they are the same population tested after a long span of time. The homozygous recessive genotype (aa) has disappeared, indicating that something must be selecting this out, possibly by having that genotype die before it gets a chance to reproduce. Additionally, the heterozygous condition (Aa) is increasing. This indicates that there is some “heterozygote advantage” as is seen in the resistance to malaria that those who are heterozygous to sickle-cell anemia display.