CS 552
CS 552. Lecture 2 Estimation-revisited Estimate size, then Estimate effort, schedule and cost from size Reuse, reuse, reuse. Boehm: “A project can not be done in less than 75% of theoretical time”. Time. T theoretical. 75% * T theoretical. Linear increase. Staff-month.

CS 552
E N D
Presentation Transcript
CS 552 Lecture 2 Estimation-revisited Estimate size, then Estimate effort, schedule and cost from size Reuse, reuse, reuse
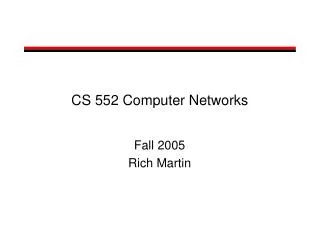
Boehm: “A project can not be done in less than 75% of theoretical time” Time Ttheoretical 75% * Ttheoretical Linear increase Staff-month Impossible design But, how can I estimate staff months? Ttheoretical = 2.5 * 3√staff-months
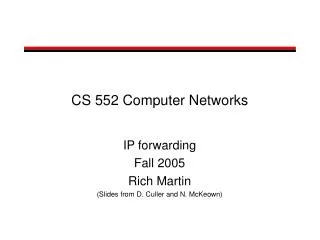
Sizing Software Projects • Effort = (productivity)-1 (size)c productivity ≡ staff-months/kloc size ≡ kloc Staff months 500 Lines of Code or Function Points
Understanding the equations Consider a transaction project of 38,000 lines of code, what is the shortest time it will take to develop? Module development is about 400 SLOC/staff month Effort = (productivity)-1 (size)c = (1/.400 KSLOC/SM) (38 KSLOC)1.02 = 2.5 (38)1.02 ≈ 100 SM Min time = .75 T= (.75)(2.5)(SM)1/3 ≈ 1.875(100)1/3 ≈ 1.875 x 4.63 ≈ 9 months
Bernstein’s rule of thumb Productivity per staff-month: • 50 NCSLOC for OS code (or real-time system) • 250-500 NCSLOC for intermediary applications (high risk, on-line) • 500-1000 NCSLOC for normal applications (low risk, on-line) • 10,000 – 20,000 NCSLOC for reused code Reuse note: Sometimes, reusing code that does not provide the exact functionality needed can be achieved by reformatting input/output. This decreases performance but dramatically shortens development time.
Trends in Software Expansion Expansion Factor The ratio of Source line of code to a machine level line of code Order of Magnitude Every Twenty Years Technology Change: Machine Instructions Macro Assemblers High Level Languages Database Managers On-Line Dev Prototyping Subsec Time Sharing Object Oriented Programming Large Scale Reuse Regression Testing 4GL Small Scale Reuse Each date is an estimate of widespread use of a software technology
QSE Lambda Protocol • Prospectus • Measurable Operational Value • Prototyping or Modeling • sQFD • Schedule, Staffing, Quality Estimates • ICED-T • Trade-off Analysis
Software Engineer’s Challenges • Is it feasible? • How much will it cost? • When will I get it? • What is the plan for producing it? • What is the basis for you answers?
Function Point Method • External Inputs • External Outputs • External Inquiries • Internal Logical Files • External Interface Files Five key components are identified based on logical user view External Input External Inquiry External Output Internal Logical Files External Interface File Application
Calculations Each identified component is assigned a Function Point size value based upon the make-up and complexity of the data Complexity Components: Low Avg . High Total Internal Logical File (ILF) __ x 7 __ x 10 __ x 15 ___ External Interface File (EIF) __ x 5 __ x 7 __ x 10 ___ 1 3 External Input (EI) __ x 3 __ x 4 __ x 6 ___ External Output (EO) __ x 4 __ x 5 __ x 7 ___ External Inquiry (EQ) __ x 3 __ x 4 __ x 6 ___ 3 ___ Total Unadjusted FPs Record Element Types Data Elements (# of unique data fields) or File Types Referenced Data Relationships Low Low Average Average High Low Average High High
When to Count SIZING SIZING PROSPECTUS IMPLEMENTATION REQUIREMENTS CORRECTIVEMAINTENANCE TESTING ACHITECTURE DELIVERY Change Request Change Request SIZING SIZING SIZING SIZING
Identify the counting boundary Definition: Indicates the border between application and external systeems or users Functionality: What Does a User See? • Data going into an application -- inputs • Data coming out of an application -- outputs, inquiries • Data, inside or outside an application -- logical files Application Inputs Outputs Data References/Feeds Data
Definition of an input An External Input (EI) processes data that comes from outside the application’s boundary. External Input 1.0 ON-LINE UPDATE CUSTOMER INFORMATION ENTRY Transaction Multi-Screen CUSTOMER INFO FILE
END USER Definition of an output An External Output (EO) generates data that is sent outside the application boundary. CUSTOMER INFO FILE External Output 1.0 Summary SUMMARIZE CUSTOMER INFO
1.0 END DISPLAY CUSTOMER INFO USER Definition of an inquiry An External Inquiry (EQ) is an output that results in data retrieval. The result contains no derived data. CUSTOMER INFO FILE External Inquiry Selected Customer Info
Definition of a file An Internal Logical File (ILF) is a user-identifiable group of logically related data that is maintained within the boundary of the application. END USER 1.0 UPDATE CUSTOMER INFO CustomerInfo UpdatedCustomerInfo CUSTOMER INFO FILE Internal Logical File
Definition of a interface file An External Interface File (EIF) is a user-identifiable group of data referenced by the application, but maintained within the boundary of another application. External Interface File ZIP CODE TABLE 1.0 VALID ZIP CODES VALIDATE ZIP CODE & UPDATE CUSTOMER INFO UPDATES UPDATES END USER CUSTOMER INFO FILE
Case History: Prospectus for Plastic Molding Inc Provide a system to inventory and control plastic molds for a variety of customers. Please track molds on hand that can re reused, parts and customer’s bill of materials. Employees need to get data from the molds inventory and form the parts inventory. Customers need to be able to modify their bills of materials. Vendor supply system needs to input data and the system needs to supply parts lists for a mold to the Inventory Manager who may modify them. The system will ncrease mold reuse by 30%. The number of customers is growing. Please use a web-based SOA system that is extendable.
Change Bill of Materials Create & Submit Parts List View Bill of Materials By Customer Change Bill of Materials Use Cases • Actors • Customer • Employees • Vendor System • Three Logical Files • Parts List • Mold List • Bills of Materials Other Use Cases: 1. Parts update 2. Parts Inquiry 3. Mold Inquiry
Logical view 2 ExternalInquiries EMPLOYEE EMPLOYEE Interfaces VENDOR INFORMATION WORK CENTERS LIST OF MOLDS 1 ExternalOutput PARTS PLANT MOLDS PARTS LISTING 3 Internal Logical Files BILL OF MATERIALS INVENTORY MANAGER ORDER PARTS & CHANGE MOLD INVENTORY PLANT INFORMATION CENTER 2 ExternalInput CUSTOMER can change BILL OF MATERIALS
DETERMINE THE FUNCTION POINT COUNT Components: Low Avg. High Total Internal Logical File (ILF) 0 x 7 2x10 1x 15 = 35 External Interface File (EIF) 0x 5 0x 7 0x 10 = 0 External Input (EI) 0 x 3 0x4 2x 6 = 12 External Output (EO) 1x 4 0X 5 0x7 = 4 External Inquiry (EQ) 0x 3 2x 4 0x 6 = 8 Total 59 COMPONENTS ARE ASSESSED BASED UPON COMPLEXITY: Data Element Types (Fields or Attributes) File Types Referenced (ILFs or EIFs) Record Element Types (Data Sub-Groups) Complexity Function Point Count
Downside • Function Point terms are confusing • Too long to learn, need an expert • Need too much detailed data • Does not reflect the complexity of the application • Does not fit with new technologies • Takes too much time • “We tried it once”
Risk factors Estimates will also vary based upon a variety of risk factors: • Technology Applied such as tools, languages, reuse, platforms • Process/Methodology including tasks performed, reviews, testing, object oriented • Customer/User and Developer skills, knowledge, experience • Environment including locations, office space • System Type such as information systems; control systems, telecom, real-time, client server, scientific, knowledge-based, web • Industry such as automotive, banking, financial, insurance, retail, telecommunications
PERFORMANCE PRODUCTIVITY CAPABILITIES MANAGEMENT DEFECTS SKILL LEVELS EFFORT PRODUCTIVITY TECHNOLOGY PROCESS TIME TO MARKET MEASURED BASELINE 35.00 30.00 Best Practices Industry Averages 25.00 20.00 Organization Baseline 15.00 RISKS PERFORMANCE 10.00 SOFTWARE PROCESSIMPROVEMENT 5.00 Sub Performance 0.00 0 100 200 400 800 1600 3200 6400 IMPROVEMENT INITIATIVES / BEST PRACTICES Baseline current levels of performance
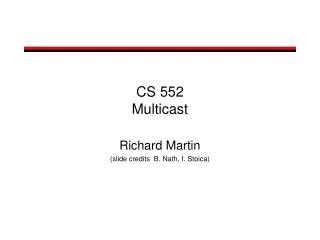
2200 2000 1800 1600 1400 Software Size 1200 1000 800 600 400 200 0 0 2 4 6 8 10 12 14 16 18 20 22 24 26 28 30 32 34 36 Rate of Delivery Function Points per Staff Month Establish a baseline Performance Productivity Size is expressed in terms of functionality delivered to the user A representative selection of projects is measured Organizational Baseline 9 Rate of delivery is a measure of productivity
Using the equations For a 59 funciton point project to be wirtten in C++, we need to write 59 x 53 = 3127 SLOC Effort = (productivity)-1 (size)c = [1/(.9 x 53 KSLOC/SM)] (3.127 KSLOC)1.02 = 2.1 (3.127 )1.02 ≈ 7 SM
2200 2000 1800 1600 1400 Software Size 1200 1000 800 600 400 200 0 0 2 4 6 8 10 12 14 16 18 20 22 24 26 28 30 32 34 36 Rate of Delivery Function Points per Person Month Monitoring improvements Track Progress Second year
ESTABLISH PROFILE ACTUALS Feedback The estimate is based on the best available information. A poor requirements document will result in a poor estimate Profile Size Time REQUIREMENT Analyst GENERATE ESTIMATE WHAT IF ANALYSIS SELECT MATCHING PROFILE SIZE REQUIREMENT Project Manager Counter Software PM / User Metrics DataBase Plan vs. Actual Report Accurate estimating is a function of using historical data with an effective estimating process.
Change of scope Initial New Estimate Function Points 60 120 Effort (staff months) 7 14 +7 Schedule (months) 3 5 +2 Staffing Levels (FTE) 3 3 -0- Production Rate (FP/mo) 9 9 -0-
Communicating impact and options Additional Additional Additional New FP Effort Cost Schedule @ $10k/sm Change in ScopeCount (staff mo.) ($000)___ (months) Add Vendor Function 10 5 50 2.0 Graphical Displays 2 0.5 5 .4 Banking System 2 0.5 5 .4 Mandatory Changes 1 1 10 .2 Total 15 7 $70 3.0 mos. OPTIONS 1. Increase funding level and schedule 2. Simplify Function 2. Reduce functionality, or do not accept change 3. Trade off quality and maintenance costs for schedule 4. Delay delivery of change 5. Add one more person
Computing Function Points See http://www.engin.umd.umich.edu/CIS/course.des/cis525/js/f00/artan/functionpoints.htm
Specification for CS 552 Development Plan • Project • Feature List • Development Process • Size Estimates • Staff Estimates • Schedule Estimates • Organization • Gantt Chart