Download
1 / 34
340 likes | 532 Vues
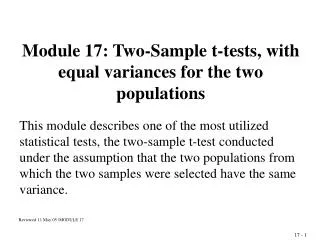
Module 17: Two-Sample t-tests, with equal variances for the two populations. This module describes one of the most utilized statistical tests, the two-sample t-test conducted under the assumption that the two populations from which the two samples were selected have the same variance.

E N D
Module 17: Two-Sample t-tests, with equal variances for the two populations This module describes one of the most utilized statistical tests, the two-sample t-test conducted under the assumption that the two populations from which the two samples were selected have the same variance. Reviewed 11 May 05 /MODULE 17 17 - 1
Up to this point, the focus has been on a single population, for which the observations had a normal distribution with a population mean and standard deviation . From this population, a random sample of size n provided the sample statistics and s as estimates of and , respectively. We created confidence intervals and tested hypotheses concerning the population mean , using the normal distribution when we had available the value of and using the t distribution when we did not and thus used the estimate s from the sample. This circumstance is often described as the one sample situation. The General Situation 17 - 2
Clearly, we are often faced with making judgments for circumstances that involve more than one population and sample. For the moment, we will focus on the so-called two sample situation. That is, we consider two populations. Question: Do you believe the two populations have the same mean? 17 - 3
Two Sample Hypotheses H0: A = B versus H1: AB or equivalently H0: Δ = A - B = 0 versus H1: Δ = A - B 0. 17 -
Parameters vs. Estimates 17 - 4
We are interested in Δ = µ1 - µ2 If the samples are independent, then When 17 - 5
Estimating σ2 we have two estimates of σ2 , one from sample 1, namely s12 and one from sample 2, namely s22. How can we best use these two estimates of the same thing. One obvious answer is to use the average of the two; however, it may be desirable to somehow take into account that the two samples may not the same size. If they are not the same size, then we may want the larger one to count more. 17 - 6
Hence, we use the weighted average of the two sample variances, with the weighting done according to sample size. This weighted average is called the pooled estimate: Pooled Average 17 - 7
Estimate of Var() To estimate Var(), we can use 17 - 8
Example 1: Blood Pressures of Children To investigate the question of whether the children of city A and city B have the same systolic blood pressure, a random sample of n = 10 children was selected from each city and their blood pressures measured. These samples provided the following data: 17 - 9
We are interested in the difference: Δ = A - B and we have as an estimate of Aand as an estimate of B; hence it is reasonable to use: d = - = 105.8 - 97.2 = 8.6 (mm Hg) as an estimate of Δ = A - B. 17 - 10
We then can ask whether this observed difference of 8.6 mm Hg is sufficiently large for us to question whether the two population means could be the same, that is, A = B. Clearly, if the two population means are truly equal, that is, if A = Bis true, then we would expect the two sample means also to be equal, that is = , except for the random error that occurs as a consequence of using random samples to represent the entire populations. The question before us is whether this observed difference of 8.6 mm Hg is larger than could be reasonably attributed to this random error and thus reflects true differences between the population means. 17 - 11
Example 2 (contd.) 17 - 15
Example 2 (contd.) 1. The hypothesis: H0 : 1 2vs. H1: 1 2 2. The assumptions: Independent random samples from normal distributions, 3.The level: = 0.05 4. The test statistic: 5. The critical region:Reject H0 if t is not between 17 - 16
6. Test result: 7. The Conclusion: Reject H0 since t = 2.5 is not between ± 1.97; 0.01 < p < 0.02 17 - 17
55.35 175.03 Source: AJPH, July 1994; 89:1068 Example 3 (contd.) 17 - 19
The hypothesis: H0 : µ1 = µ2 vs. H1: µ1≠ µ2 • The assumptions: Independent random samples from normal distributions • 3. The level: = 0.05 • 4. The test statistic: 17 - 20
5. The critical region: Reject if t is not between t0.975(1738) =1.96 6. The Result: 7. Conclusion: Accept H0: 1 = 2, since p > 0.05 ; 0.05 < p < 0.10 17 - 21
1. The hypothesis: H0: SSS = NHS vs. H1: SSS≠ NHS • The level: = 0.05 • 3. The assumptions: Independent Samples, Normal Distribution, • 4. The test statistic: • 5. The critical region: Reject if t is not between ± 2.1315 17 - 23
6. The result : • The conclusion: Reject H0: SSS = NHS ; 0.01< p < 0.02 17 - 24
Independent Random Samples from Two Populations of Serum Uric Acid Values 17 - 25
Serum Acid Worksheet 17 - 26
s12 = 0.09, s22 = 0.19 17 - 27
1. The hypothesis: H0: μ1 = μ2 vs. H1: μ1≠ μ2 2. The -level: = 0.05 3. The assumptions: Independent Random Samples Normal Distribution, 4. The test statistic: Testing the Hypothesis That The Two Serum Uric Acid Populations Have The Same Mean 17 - 28
5. The reject region: Reject H0: μ1 = μ2 if t is not between ± t0.975(18) = 2.1009 6. The result: 7. The conclusion: Reject H0: μ1 = μ2 , since t is not between ± 2.1009 17 - 29
Serum Uric Acid Values Before And After a Special Meal 17 - 30
1. The hypothesis: H0: Δ = 0 vs. H1: Δ ≠ 0, where Δ = μAfter - μBefore 2. The -level: = 0.05 3. The assumptions: Random Sample of Differences, Normal Distribution 4. The test statistic: Testing the Hypothesis That The Serum Uric Acid Levels Before and After A Special Meal Are The Same 17 - 32
5. The rejection region: Reject H0: Δ = 0, if t is not between ± t0.975(9)= 2.26 6. The result: 7. The conclusion: Reject H0: Δ = 0 since t is not between ± 2.26 17 - 33