Download
1 / 73
730 likes | 864 Vues
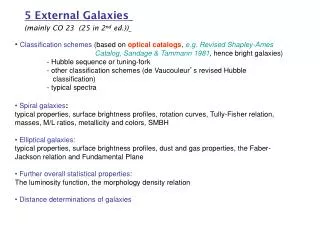
5 External Galaxies (mainly CO 23 (25 in 2 nd ed.)). Classification schemes (based on optical catalogs , e.g. Revised Shapley-Ames Catalog , Sandage & Tammann 1981 , hence bright galaxies) - Hubble sequence or tuning-fork

E N D
5 External Galaxies (mainly CO 23 (25 in 2nd ed.)) • Classification schemes (based on optical catalogs, e.g. Revised Shapley-Ames Catalog, Sandage & Tammann 1981, hence bright galaxies) • - Hubble sequence or tuning-fork • - other classification schemes (de Vaucouleur’s revised Hubble • classification) • - typical spectra • Spiral galaxies: • typical properties, surface brightness profiles, rotation curves, Tully-Fisher relation, masses, M/L ratios, metallicity and colors, SMBH • Elliptical galaxies: • typical properties, surface brightness profiles, dust and gas properties, the Faber-Jackson relation and Fundamental Plane • Further overall statistical properties: • The luminosity function, the morphology density relation • Distance determinations of galaxies
5.1 Classificiation Schemes: The Hubble sequence 1924, Edwin Hubble divided galaxies into different “classes” based on their (optical) appearance. • Why begin here? • Hubble classification serves as the basic language of the field. • The morphological sequence reflects a fundamental physical and evolutionary sequence, which offers important clues to galactic structure, formation and evolution. • BUT Appearance of galaxy depends on: • inclination • resolution of image • depth of exposure • wavelength • (redshift)
Hubble Tuning Fork diagram (Hubble 1936, The Realm of the Nebulae) Ellipticals →Lenticular → Normal Spiral →Irregular and Barred Spiral Evolutionary Sequence ? -- NO!! Early types Late types For fantastic illustrations see: The Hubble Atlas of Galaxies (Sandage 1961); Carnegie Atlas of Galaxies ( Bedke & Sandage 1994); The Revised Shapley Ames Catalogue (Sandage & Tammann 1981)
Spiral Galaxies • Disk + spiral arms + bulge (usually) • Subtype a b c defined by 3 criteria: • Bulge/disk luminosity ratio • Sa: B/D>1 Sc: B/D<0.2 • Spiral pitch angle • Sa: tightly wound arms Sc: loosely wound arms • Degree of resolution into knots, HII regions, etc.
Barred Spiral Galaxies • Contain a linear feature of nearly uniform brightness centered on nucleus • Subclasses follow those of spirals with subtypes a, b and c • Note: hard to differentiate in edge-on galaxies
Elliptical Galaxies • Smooth structure and symmetric, elliptical contours • Subtype E0 - E7 defined by flattening • En where n = 10(a-b)/a • where a and b are the projected major and minor axes • (doesn’t tell what the 3-D shape is see next sheet) • BUT NOTE: • many dwarf elliptical galaxies exist: e.g. NGC 147 (dE3), NGC 205 (dE5) and M32 (dE2) in Local Group; very low luminosity, difficult to detect (between E and GC) • dwarf spheroidal galaxies (dSph); Sculptor system discovered by Shapley 1932
Dwarf Elliptical Galaxies (incredible range in mass and luminosity from brightest to faintest elliptical galaxies) NGC 147 (dE3) : NGC 205 (dE5) : IIIaJ DSS, 40’ x 40’ JHK 2MASS 12’ x 12’ IIIaJ, DSS10’ x 10’ JHK 2MASS 21’ x 21’ M32 (dE2) : Sculptor dSph IIIaJ DSS, 6’ x 6’ JHK 2MASS 8’ x 8’ IIIaJ DSS, 60’ x 60’
Lenticulars or S0 Galaxies • Smooth, central brightness concentration (bulge similar to E) surrounded by a large region of less steeply declining brightness (similar to a disk) • No spiral arm structure (though sometimes with dust, see below) • Originally thought to be transition objects between Sa and E, but typically S0 are 1-2 mags fainter than standard Sa’s or E’s (van den Bergh 1998) • later addition by Sandage: S01, S02, S03 (function of dust content) • SB01, SB02, SB03 (function of strength of bar)
Irregular Galaxies NGC 4485 & NGC 4490 NGC 4449 M82 massive irregular • No morphological symmetry • Lots of young, blue stars and interstellar material • Smaller than most spirals and elliptical galaxies • Two major subtypes: • Irr I: highly resolved but disturbed spiral-like shapes • Irr II: smooth but chaotic (e.g. M82) with gas filaments
General trends within Hubble sequence E → S0 → Sa → Sb →Sc: • Decreasing Bulge/Disk • Decreasing stellar age • Increasing fractional gas & dust content • Increasing ongoing star formation • Decreasing mass & luminosity • Limitationsof the Hubble Classification Scheme • Only includes massive galaxies (doesn’t include dwarf spheroidals, dwarf irregulars, blue compact dwarfs) • Three different parameters for classifying spirals is unsatisfactory because the parameters are not perfectly correlated. • Bars are not all-or-nothing. There is a continuum of bar strengths.
de Vaucouleurs’ Revised Hubble Classification System • (de Vaucouleurs 1958, Handbuch der Phys. 53, 275) • (de Vaucouleurs2 1964, Reference Catalog of Bright Galaxies) • Basic idea: retain Hubble system, but add lots of optional bells and whistles • Mixed types: E/S0, Sab, Sbc • Mixed barred/normal: SA (unbarred), SB (barred), SAB (in between) • Inner rings: S(s) (arms out of ring), S(r) (arms in ring), S(rs) • Outer rings: (R) S • Extended spiral, irr types: Sm (between spiral and Irr), Im (magellanic), Sd (extreme Sc), Sdm (between Sd and Sm) • “T-types” scale Added in later editions of the Reference Catalog • (de Vaucouleurs2, Corwin 1976) • E0 E/S0 S0 Sa Sb Sc Sd Sm Im • -5 -3 -1 1 3 5 7 9 10 (T-type)
Schematic Diagram of Revised Hubble Classification Cross section of diagram No Bar Ring shaped Spiral shaped • Limitations: • E --- Im is not a linear sequence of one parameter • Rings and bars are not independent • Does not take into consideration mass or other important parameters. All based on optical surface brightness morphology. Bar NGC 6782 (R')SB(r)0/a
Schematic Diagram of Revised Hubble Classification Cross section of diagram No Bar Ring shaped Spiral shaped • Limitations: • E --- Im is not a linear sequence of one parameter • Rings and bars are not independent • Does not take into consideration mass or other important parameters. All based on optical surface brightness morphology. Bar NGC 6782 (R')SB(r)0/a
Schematic Diagram of Revised Hubble Classification Cross section of diagram No Bar Ring shaped Spiral shaped • Limitations: • E --- Im is not a linear sequence of one parameter • Rings and bars are not independent • Does not take into consideration mass or other important parameters. All based on optical surface brightness morphology. Bar NGC 6782 (R')SB(r)0/a
Schematic Diagram of Revised Hubble Classification Cross section of diagram No Bar Ring shaped Spiral shaped • Limitations: • E --- Im is not a linear sequence of one parameter • Rings and bars are not independent • Does not take into consideration mass or other important parameters. All based on optical surface brightness morphology. Bar NGC 6782
Luminosity Classification or “DDO System” (LC I to V w. intermediate LC) van den Bergh (1960) - who was at David Dunlop Observatory in Ontario, Canada - hence the “DDO” In spirals and irregular galaxies, some properties correlate with galaxy mass/luminosity rather than type. The better defined the spiral features (i.e. arm length, continuity and width relative to size) the more luminous (intrinsic). Sc I - long, well-developed arms Sc III - short, stubby arms Sc IV - dwarf, spiral galaxy - faint hint of spiral structure Calibration of LC with absolute magnitude Used by Sandage and Tamman as distance indicator
Automated galaxy classification • Abraham et al. (1994, 1996): • Concentration parameter C - fraction of light within ellipsoidal radius 0.3 x outer isophotal radius (1.5 above sky level). • Asymmetry parameter A - fraction of light in features not symmetric wrt a 180 degree rotation • Naim, Ratnatunga & Griffiths (1997) use 4 parameters: blobbiness, asymmetry, filling factor and elongation. • Naim et al. (1995) used artificial neural nets to classify galaxies into the numerical T types.
Spectra of galaxies from E Im: • Continuum: sharp break and rise after H and K lines (hence brighter in red than blue); dominated by red star light, strong absorption lines; • E and S0 have K-star type spectrum • Flattening of continuum (reduction of red light compared to blue light) • Spirals: F-K stars dominate spectrum • Decrease in strength of absorption lines • Increase in emission lines and strength of emission lines; A-star dominate spectrum but also • - lots of SF, many O, B stars: • - abs. lines of He (typical of O, B stars) • - em. lines of ionized gas Kennicutt (1992) H,K G Mg Na Galaxies are shown in order of increasing Hubble type from top to bottom. OII OIII H,NII Hβ NeII Hγ He SII
Comparative properties of various spiral galaxies and elliptical galaxies:
Dependence of color with Hubble type • → indicates intrinsic differences for the different morphological types • therewith of interest to study at different wavelength-ranges • but implies dependency on regarded waveband with prominence • of the respective morphological types
5.2 Spiral Galaxies Photometric properties of spirals Problem 1: spirals are not transparent, contain varying amounts of dust complicates determination of true shape in 3D and the true magnitude Problem 2:sky background – the dimly glowing night sky has an average of μsky = 22 B-mag arcsec-2 (light pollution, zodiacal light, unresolved stars of Milky Way, unresolved galaxies) But modern CCD’s: follow SB profile of galaxy to SB levels of 29 B-mag arcsec-2 it is necessary to do careful sky-subtraction Typical Surface Brightness profile of spiral galaxy
Recap: some definitions Units of surface brightness SB (independent of distance): mag arcsec-2 → if a galaxy has a SB = 20 mag arcsec-2; photons incident on 1 sq. arcsec ↔equal to star with m = 20 Notation: μB = 20m : surface brightness in the B band of 20 mag arcsec-2 Note: typical central SB of a galaxy in the B-band: μB = 18 mag arcsec-2(bulge/nucleus) Typical isophote out to which a galaxy can be traced on e.g. Sky Surveys in the blue (IIIaJ) is 27 mag arcsec-2(~1% of sky-brightness) Galaxies do not have sharp edges: definition of Isophotal radius (or diameter) → radius (or diameter) at which a certain SB is reached e.g. R25 diameter at SB = 25 μB (if seen f-o and unobscured by dust); (defined and often used, e.g. in the Reference Catalogues (de Vaucouleurs, de Vaucouleurs & Corwin, 1976, 1991) (Holmberg radius: RH at the isophote of 26.5 mag arcsec-2; older definition, not much used anymore) Total magnitude: integrated SB across galaxy image (but edge not well-defined) – asymptotical value mT or MT) Isophotal magnitude: integrated magnitude out to some limiting isophote, e.g. mB25
Disk: • After correction for inclination, dust obscuration and averaging over spiral arms • the SB profile of a spiral disk falls of as an exponential • with I0 …. Central surface brightness of disk • hR …. Characteristic scale length • In practice, SB at the center of a spiral is dominated by central bulge or spheroid • I0 to be estimated from extrapolations inwards from larger radii Typical values for scale lengths are: 1kpc < hR< 10 kpc In many (but not all) spiral galaxies, the exponential part seems to end at some radius Rmax which typically is Rmax = 3 – 5 hR (10-30 kpc) hR generally is about 20% larger in B than R Beyond Rmax the SB of the stars decreases more rapidly – edge of optical disk
Freeman’s law for normal spiral galaxies (not LSB dwarf-like objects) • Freeman (1970) found: high SB galaxies all have the same central SB • SB0= 21.7 mag arcsec-2;(SBK ~ 18 mag arcsec-2) • but note: less in low SB galaxies e.g. Malin 1 (V ~ 25’000km/s) μ0,B ~ 25.5 mag arcsec-2 25 times fainter than ‘normal’ spiral galaxies and well below the sky brightness Recall sky brightness in B on a dark night is 22.7 mag arcsec-2
Malin 1 (discovered 1987): DSS-image of 8’ x 8’ Strong bulge, weak extended disk with hR ~ 55 kpc (!!) V-band image with HI-contour overlay (Pickering et al. 1997, AJ) M(HI) = 6.8 x 10¹⁰ Msun
Malin 1 (discovered 1987): DSS-image of 8’ x 8’ Strong bulge, weak extended disk with hR ~ 55 kpc (!!) V-band image with HI-contour overlay (Pickering et al. 1997, AJ) M(HI) = 6.8 x 10¹⁰ Msun
Freeman’s law for disk galaxies • Freeman (1970) found: high SB galaxies all have the same central SB • SB0= 21.7 mag arcsec-2;(SBK ~ 18 mag arcsec-2 • but note: less in low SB galaxies • (b) Bulge: • In the central regions we have an additional light component due to the bulge • Bulge usually follows R1/4law like ellipticals • SB profiles of spirals require 2 separate fits • - one for disk • - one for bulge • For bulges, the central SB is 20-21 mag arcsec-2 • (de Souza et al. 2004, ApJS, 153, 411) (c) Halo Doesn’t contribute much light, so people generally don’t worry about it.
The rotation curves of galaxies: • SB profiles sample the distribution of luminous matter - but not the distribution of gas or dark matter • Recall: Observations of neutral hydrogen gas HI (~30 – 100K) using radio telescopes to map HI emission at λ = 21cm (1420.406MHz) • the resulting rotation curves are a good measure of the total matter distribution (luminous, gas + dark matter) • When rotation curves are compared with luminosity or Hubble type, a number of correlations are found (see next sheet): • - with increasing luminosity in the B-band, the rotation curves rise more rapidly (from center) and reach higher maximum velocities • - within a given Hubble type, galaxies that are more luminous have larger Vmax • Although the maximum rotational velocity within the disk increases for earlier-type galaxies a wide range in Vmax exists for each type, depending on luminosity: • - Sa: 299 km/s (range: 163 – 367 km/s), • - Sb: 222 km/s (range: 144 – 330 km/s), (recall MW: Vmax~ 250 km/s) • - Sc: 175 km/s (range: 99 – 304 km/s) • Indication of DM content, which does not always follow the distribution of luminous matter The maximum rotation velocities for irregular galaxies is significantly lower: about 50 – 70 km/s (suggest that higher rotational velocities –and mass - are required for well-organized spiral patterns to occur)
with increasing luminosity in the B-band, the rotation curves rise more rapidly (from center) and reach higher maximum velocities • - within a given Hubble type, galaxies that are more luminous have larger Vmax • Although the maximum rotational velocity within the disk increases for earlier-type galaxies a wide range in Vmax exists for each type, depending on luminosity: • - Sa: 299 km/s (range: 163 – 367 km/s), • - Sb: 222 km/s (range: 144 – 330 km/s), • - Sc: 175 km/s (range: 99 – 304 km/s) • BUT rotation curves are difficult to measure (radio interferometry for HI, or longslit spectroscopy of ionized gas of emission lines Hα, OII or OIII). • Go to single dish radio telescopes and measure velocity width: Rubin et al. 1985, ApJ 289, 81
What can be learned from single dish observations? The double peak occurs because a portion of the disk is rotating towards the observer (blueshift) another part is moving away (redshift). The mean is the systemic radial velocity of the galaxy as a whole • - Systemic radial velocity Vsys – generally the central value of linewidth • - Linewidths ΔV (in km/s) - which is indicative of 2x maximal rotation velocity, usually measured at 20% or 50% of the peak flux of the signal • but requires correction for inclination: • i … inclination
Or: • WhereΔV20 isthe linewidth measured from the 21cm radio velocity profile at the 20% level of emission from the peak flux, and ΔVranda random velocity component due to non-circular velocities in the gas (of the order of 5 - 15 km/s) • Other parameters that can be deduced from single dish observations: • - Integrated flux: in Jy km/s • - HI-mass: in Msun with D …. distance in Mpc • Some values for the Tully-Fisher relation • Note: magnitudes need to be corrected for internal extinction effect; • - but whereas high inclinations minimize errors in linewidth corrections (full rotational effect seen in edge-on spirals), these are largest for magnitude corrections (sheet 9, chap. 2) • Tighter relation in the near-infrared: e.g. calibration by Pierce & Tully (1992) for the H-band: For same linewidth an Sc will be brighter than Sb than Sa
The Tully- Fisher relation – an important distance indicator • Plot: • - log of linewidth (corrected for inclination) • - total magnitude (corrected for inclination • and extinction – internal and external) • Very tight correlation • (smallest scatter when measure in NIR • compared to bluer colors) • distances: • - Determine Vmax or linewidth • - Infer M for a given band from calibrated relation • - Measure apparent magnitude in that band • Use distance modulus (m-M) = 5 logD - 25 (Mpc) Very important distance determinator out to about 100 - 200 Mpc (radial velocities 2000 - 4000 km/s) and even higher for clusters of galaxies highly relevant for measuring peculiar velocity/cosmic flow fields But error for individual galaxy still quite high: about 0.4m in optical to 0.2m in NIR ( about 20% respectively 10% in distance!!)
The origin of the Tully-Fisher relation: • - Empirical linear relation between total magnitude and HI-linewidth • Implies: L prop. Vmax4 • What is the underlying physics for this relation? • Recall that for an entire galaxy with radius R and total mass M: • (sheet 15, chap. 4 for r R and Mr M; see also sheets 16 - 18, chap.4) • Assume that the M/L is constant for all spirals (BUT we do know that that does not hold) : • Recall Freeman’s law: all spirals have same central SB (21.7 mag arcsec-2 in B) • Squaring the previous relation for L and substituting R² from central SB relation: • Tightness of relation demands a nearly universal M/L ratio – which remains un-understood! Surprisingly, the slope comes out about right wrt what has been found
Radius Luminosity relation For early type spirals (Sa – Sc) the radius increases as a function of luminosity With R25 in units of kpc. Masses and M/L ratios The above relation plus the TF relation allows an estimate of mass and M/L within R25 - weak relation only of mass with Hubble type (~109-1012 Msun) - M/L increases with Hubble type (see Table on sheet 17): Sa Sb Sc <M/LB> = 6.2 ± 0.6 4.5 ± 0.4 2.6 ± 0.2 Color and abundance of gas and dust The above relation indicates that Sc must have a larger fraction of massive MS stars bluer (see sheet 18: <B - V> versus T-type) Sa Sb Sc Im <B - V> = 0.76 0.64 0.52 0.4 The colors of Im’s become blueer towards their centers (contrarily to earlier spirals which are redder in their centers – see next section) still manufactoring stars in their central regions existence of abundant supply of gas and dust from which stars can be formed
Based on 21cm radiation, H emission and CO (as tracer of H2) it was found that within R25 the - gas-to-total mass fraction increases from early to late spirals - the molecular to atomic gas fraction decreases: Sa Sb Sc Scd <Mgas/Mtot> = 0.04 0.08 0.1 0.25 <MH2 /MHI> = 2.2 1.8 0.73 0.29 Increase in gas content is as expected based on observations. More molecules in earlier spirals is interpreted as them having deeper gravitational wells (more centrally condensed) in which gas can collect and form molecules. Molecular gas mass decreases from about 5 x 10¹⁰Msun in most massive galaxies to 106Msun in dwarf spirals The dust mass is usually 150-600 times lower than gas in ISM; dust is primarily responsible for FIR luminosity (some synchrotron and star emission) IRAS observations found following tendencies between FIR/blue luminosity: M31 M33 M101 LMC SMC Sb I-II Sc II-III Sc I SBm III Im IV-V <LFIR/LB> = 0.07 0.2 0.4 0.18 0.09 Sc’s have the largest FIR luminosity, consistent with them having the most mass in gas and dust Note: SB (barred spirals) generally have larger FIR emission than their non-barred counterparts
Metallicity and Color gradients in spirals • Apart from overall color dependence on Hubble type, galaxies also exhibit metallicity gradient from central core to outer parts • bulges are generally redder than disks; spheroids are redder in central part than further out • Dependence on star formation • More active SF in disks (increasing as function of T) results in overall bluer color, whereas spheroidal components (bulges) have little gas – overall redder color • Dependence on metallicity (opacity) • The average number of electrons per atom is higher for metal-rich stars higher opacity (more possible orbital transition of electrons) • Higher opacity – light cannot escape as easily radius increases (star puffs up) decrease in surface temperature • higher metallicity higher opacity lower SF temp redder • Bulges are more metal-rich redder. But it is an overall gradient from inner to outer part. This has been measured in our Galaxy. For 4 14 kpc: • And also in our other galaxies
In addition to a metallicity gradient that decreases from the central parts to the outer parts overall dependence of luminosity with metallicity has been found holds for spirals and ellipticals both Chemical enrichment must have been more efficient for luminous galaxies (important for galaxy formation and evolution theories) Solar From Mg absorption lines From HII-regions (emission) E dE Solar Sp Im
Supermassive Black Holes Observations of stellar and gas motions near centers of spirals suggest presence of SMBH, Rotational-velocity measurements can be used to estimate the dynamical mass of a central black hole in the same was as for SgrA* in Galactic Center: • Example NGC 4258, a nearby spiral at 6 Mpc • Compelling evidence for a supermassive black hole from VLBA observations (100 times resolution of HST) • a group of molecular clouds swirling in an organized fashion about the galaxy's core • red- and blueshifts of water-vapor spectral lines • the pattern revealed is that of a slightly warped and spinning disk centered precisely on the galaxy's heart. • The rotation velocities imply the presence of more than 4 107 Msunwithin a region less than 0.2 pcacross.
(b) Other strong evidence: M31 • Observational evidence up to 2005: • - Asymmetric nucleus, i.e. offset of the brightest point from bulge center and velocity dispersion peak • - Hubble Space Telescope imaging shows: • double nucleus with two bright intensity peaks in a spectrum including Ca II lines (red part of visible spectrum) • (bright nucleus P 1, faint nucleus P 2) • Rotation curve is approximately symmetric about the faint nucleus P2 ! • Estimate of mass of BH: 3 – 10 x 107 Msun (large range)
New observations with HST (Bender et al. 2005, ApJ 631,280): • Third nucleus (P3) within P2 composed - of population of blue young stars (A to B stars, recently formed) - very high vel. dispersion (~1100 km/s) ; consistent with rotating circumstellar disk 1.1 – 2.3 x 10⁸Msun Note: cluster of dark objects excluded; but way beyond BH-mass/luminosity, BH-mass vel.dispersion relation (next sheet) Determination of central BH mass from velocity dispersion via Virial Theorem (not as precise as kinematic studies) If a galaxy is in equilibrium, the virial theorem holds, i.e. the time-averaged kinetic and potential energies of stars in the central region (bulge) follow: For the large number of stars we are regarding, the time average will be the same as the sum over all stars. So, for N stars we have Assume for simplicity spherical cluster of radius R and N stars, each of mass m M = Nm and divide above expression by N results in:
Generally we can only measure radial velocities (galaxies are too far away to be able to measure proper motions). But the value of the radial velocity should not be different for the perpendicular 2 components (we have no preferred orientation when studying clusters). Therefore the average values so Substituting this into the equation at the top, and using the expression for the approximate potential energy of a spherical distribution of total mass M and radius R : Using M = Nm and solving for the mass a relation between the mass and the vel.dispersion: R must be selected properly (within sphere of influence of BH). Farther away mass from stars and gas will contribute to total mass within regarded sphere. Look for peak in σ as f(R).
Including this method (next to 3 precise determinations of BH’s for Galaxy, M31 and NGC 4258) gives sufficient numbers of nearby galaxies with central BH estimates to check for correlations of BH mass with galaxy properties Strong correlation of BH mass with LB and σof E’s and bulges of spiral(but most recent results for M31 are deviant) N205,M33 M32 → M87 Existence of fundamental link between feeding of BH and overall mass of galaxy
Specific Frequency of Globular clusters Abundance of glob. clusters shows an increasing tendency from late type spirals early-type spirals ellipticals cD’s. Implications for galaxy formation theories: more spheroidally dominant galaxies seem to have been more efficient at forming GC during their early histories. Moreover, capturing of globular clusters in merging or cannibalism processes. Definition of specific frequency of globular clusters: Where LV is the galaxy’s luminosity ; L15 the reference luminosity corresponding to MV = -15mag. The mean (and scatter) increases as with decreasing type T: Particularly cD’s which often reside at the centers of massive galaxy cluster have an extraordinary high number of globular clusters. Harris, ARvA&A 1991
5.2. Elliptical Galaxies Ellipticals look like simple objects - round, smooth light distribution (lack of SF regions, obscuring dust patches) - devoid of cool gas (except very centers), no disk (like S0) But detailed studies show: • huge range of luminosity and light concentration • some rotate, others not (or hardly) • existence of oblate, prolate and triaxial shapes Recall: 5 main types of elliptical galaxies (sect. 5.1 on morphology and table on sheet 17): Giant ellipticals (cD): immense, massive and bright galaxies found at the center of rich galaxy clusters with -22 < MB < -25, 1013 < M < 1014Msun, central high SB with extended diffuse envelopes, up to ten’s of thousands of GC (<SN> =15), extreme M/L ratios (~750 Msun/Lsun) Normal ellipticals (E): centrally condensed objects with high central SB; -15 < MB < -23, 108 < M < 1013Msun, diameters from 1 - 200 kpc, and M/L ratios ranging from 1 – 100 Msun/Lsun; <SN> ~ 5 Dwarf ellipticals (dE): lower SB and metallicity compared to E of similar absolute magnitude; -13< MB < -19, 107 < M < 109Msun, diameters from 1 - 10 kpc; higher <SN> than spirals (~5) Dwarf spheroidals (dSph): extremely low luminosity, low SB and small: -8 < MB < -15, 107 < M < 108Msun, 0.1-0.5kpc diameter; only known in vicinity of MW; but fairly high M/L (5 -100) Blue compact dwarfs (BCD): small and unusually blue (<B-V>=0.0 - 0.3) mean A-type spectrum lot of recent SF; -14 < MB < -17; M ~109Msunand D less than ~ 3kpc; have large fraction of gas (15-20% of total mass!!), and lower M/L compared to other E’s
Surface Brightness profiles The surface brightness distribution follows the so-called de Vaucouleurs’ R¼ - law (first formulated by him for SB profiles of ellipticals in 1948), as seen already for Gal.Bulge With scale length Re known as the effective radius defined such that half the total light of the system is emitted within the interior of Re; The parameter Ie is the SB at R = Re Major axis SB-profile for NGC 1700: → smooth increase in SB (over 10mag in SB, thus over 10’000 in intensity) from outer edge to center, slightly flattening of at center
Deviations from R¼ law: • (A) profile curves downwards in in μB - R¼ plot for low lum. Ellipticals • Some of the very extreme diffuse dE’s and dSph’s are actually best fitted by an exponential law I(R) = I0exp(-R/Rh) …. But are not rotationally flattened objectsas analysis of ellipticities indicates; Ichikawa, Wakamatsu & Okamura 1986) • (B) profile curves upwards in μB - R¼ plot (top) for high lum. ellipticals, cD’s • See Fig. on right for extreme case : • cD at the center of Abell 1413 • -- points are observations, • -- line is R¼ fit to inner points with • – R > 20Re
Dust and Gas in Ellipticals (very little): • It was generally thought that ellipticals are free • of dust and gas (therefore no star formation) • with few exceptions such as interacting galaxies • (acquired gas; e.g. the nearby CenA galaxy ) • This holds indeed for • dE and dSph’s: • The low grav. binding energy does not allow these • galaxies to retain a significant amount of gas • They are not actively forming stars - They have very low metallicities (similar to glob. clusters) • They must have lost their gas - via SN-driven mass loss • - ram-pressure stripping as galaxies pass through gas in clusters • BUT closer examination or large E • Normal and cD galaxies: • - some have dust in center, presumably mixed with cold gas • - but only 5-10% of normal E have sufficient HI to be detectable • Some E’s show peculiarities (often show shells and dust lanes) and can have as much cool gas as normal spirals NGC 5128 = Cen A
Normal and cD galaxies (cont.): • The hydrogen gas manifests itself in different forms: • (a) Hot gas (dominant gas fraction): • 1-3 x 10⁷K (radiates in X-ray), is diffuse and extends to >~ 30kpc • From mass loss of older stars older than few Gyrs • (from red giant and AGB): • 1-2 Msun per yr per 1010 Lsun → large gas reservoir • Total gas mass: 108-1010Msun (up to 10-20% of luminous mass) • More luminous ellipticals (higher vel. dispersion) have hotter gas • (b) Warm gas (very little): • ~ 104K observable in H (around PN or HII regions) • Total mass of 104-105Msun • (c) Cold gas : • ~100K • - observable as HI in 21cm line • → cold gas in luminous E’s : ~ 107-109Msun (compare to Sc: 1010Msun) • - CO emission indicate molecular hydrogen H2, also of the order of 107-109Msun • DUST: • Observations indicate that ~50% of ellipticals also do contain some dust, but little in mass contribution (105-106Msun)