Connectivity-Based Parcellation of the Medial Frontal Cortex: Insights from fMRI and Diffusion Data
This study investigates medial frontal cortex parcellation using connectivity-based methods to explore the relationship between brain structure and function. Employing fMRI and diffusion-weighted imaging, we defined distinct regions in the medial frontal cortex based on their connectivity profiles. Our findings highlight how the Supplementary Motor Area (SMA) and pre-SMA exhibit different connection patterns, correlating with functional tasks. This methodology offers a novel approach for mapping structure-function relationships in the human brain and provides insights into the anatomical organization of cortical grey matter.

Connectivity-Based Parcellation of the Medial Frontal Cortex: Insights from fMRI and Diffusion Data
E N D
Presentation Transcript
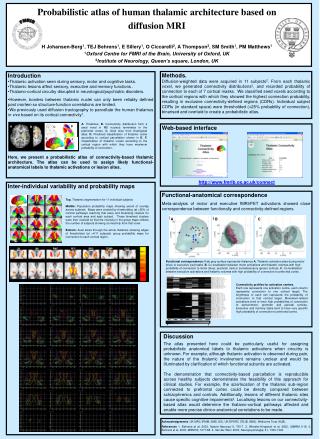
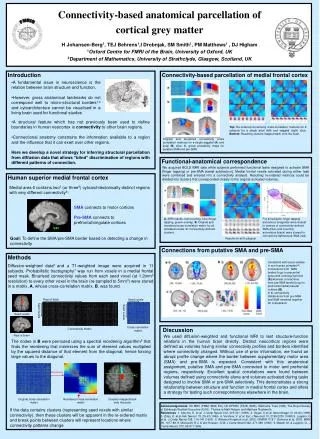
FMRIB VAC VAC Rest of brain Seed voxels Seed voxels Seed voxels Seed voxels Cross-correlation matrix Connectivity matrix Rest of brain Reordering Original cross-correlation matrix Reordered cross-correlation matrix Clusters mapped back onto the brain Connectivity-based anatomical parcellation of cortical grey matterH Johansen-Berg1, TEJ Behrens1,I Drobnjak, SM Smith1, PM Matthews1 , DJ Higham1Oxford Centre for FMRI of the Brain, University of Oxford, UK2Department of Mathematics, University of Strathclyde, Glasgow, Scotland, UK Introduction Connectivity-based parcellation of medial frontal cortex • A fundamental issue in neuroscience is the relation between brain structure and function. • However, gross anatomical landmarks do not correspond well to micro-structural borders1,2 and cytoarchitecture cannot be visualised in a living brain used for functional studies • A structural feature which has not previously been used to define boundaries in human neocortex is connectivity to other brain regions. • Connectional anatomy constrains the information available to a region and the influence that it can exert over other regions. • Here we develop a novel strategy for inferring structural parcellation from diffusion data that allows “blind” discrimination of regions with different patterns of connection. Top: Re-ordered connectivity cross-correlation matrices for 9 subjects for a single axial (left) and saggital (right) slice. Bottom: Resulting clusters mapped back onto the brain. Original and reordered connectivity cross correlation matrices for a single saggital (A) and axial (B) slice. C. group probability maps for putative SMA and pre-SMA Functional-anatomical correspondence We acquired BOLD fMRI data while subjects performed functional tasks designed to activate SMA (finger tapping) or pre-SMA (serial subtraction). Medial frontal voxels activated during either task were combined and entered into a connectivity analysis. Resulting re-ordered matrices could be divided into clusters that corresponded closely to the original activated volumes. Human superior medial frontal cortex Medial area 6 contains two3 (or three4) cytoarchitectonically distinct regions with very different connectivity5: SMA connects to motor cortices Pre-SMA connects to prefrontal/cingulate cortices A. fMRI results: red=counting, blue=finger tapping, green=overlap. B. Original and reordered cross-correlation matrix for all activated voxels. C. Connectivity-defined clusters. For all subjects, finger tapping activations (magenta) were closest to centres of connectivity-defined SMA (blue) and counting activations (black) were closest to connectivity-defined pre-SMA (red) Goal: To define the SMA/pre-SMA border based on detecting a change in connectivity Results for all 9 subjects Connections from putative SMA and pre-SMA Methods Diffusion-weighted data6 and a T1-weighted image were acquired in 11 subjects. Probabilistic tractography7 was run from voxels in a medial frontal seed mask. Binarised connectivity values from each seed voxel (at 1.2mm3 resolution) to every other voxel in the brain (re-sampled to 5mm3) were stored in a matrix, A, whose cross-correlation matrix, B, was found. Consistent with tracer studies in non-human primates5,8, connections from SMA tended to go to precentral gyrus and corticospinal tract (A) whereas connections from pre-SMA tended to go to prefrontal medial parietal cortices (B). In C, connectivity distributions from pre-SMA and SMA rendered together for comparison; Discussion We used diffusion-weighted and functional MRI to test structure-function relations in the human brain directly. Distinct neocortical regions were defined as volumes having similar connectivity profiles and borders identified where connectivity changed. Without use of prior information, we found an abrupt profile change where the border between supplementary motor area (SMA) and pre-SMA is expected. Consistent with this anatomical assignment, putative SMA and pre-SMA connected to motor and prefrontal regions, respectively. Excellent spatial correlations were found between volumes defined using connectivity alone and volumes activated during tasks designed to involve SMA or pre-SMA selectively. This demonstrates a strong relationship between structure and function in medial frontal cortex and offers a strategy for testing such correspondences elsewhere in the brain. The nodes in B were permuted using a spectral reordering algorithm5 that finds the reordering that minimises the sum of element values multiplied by the squared distance of that element from the diagonal, hence forcing large values to the diagonal. Acknowledgements. UK MRC (PMM, SMS, ES), UK EPSRC (TEJB, SMS), Wellcome Trust (HJB), The Royal Society of Edinburgh/Scottish Executive (DJH). Thanks to Matt Robson and Matthew Rushworth. References 1. Amunts, K. et al. J Comp Neurol 412, 319-341 (1999). 2. Geyer, S et al. NeuroImage 10, 63-83 (1999) 3. Zilles, K. et alAdv. Neurol. 70, 29-43 (1996). 4. Vorobiev, V. et al. Eur. J Neurosci 10, 2199-2203 (1998).5. Luppino, G et al. J Comp Neurol 338, 114-140 (1993). 6. Wheeler-Kingshott et al, 2002, ISMRM 1118 7. Behrens et al, 2003, MRM 50, 1077-88. 8. Morecraft, R.J. & Van Hoesen, G.W. J Comp Neurol 322, 471-489 (1992). 9. Matelli, M. & Luppino, G.. J Comp Neurol. 372, 59-87 (1996). If the data contains clusters (representing seed voxels with similar connectivity), then these clusters will be apparent in the re-ordered matrix and break points between clusters will represent locations where connectivity patterns change