Download
1 / 22
220 likes | 384 Vues
The empirical development of a therapeutic formula for the treatment of malnutrition from F100 to therapeutic pastes (RUF). Importance of delivering the full spectrum of micronutrients to acutely malnourished children Michael Golden. MSF satellite meeting, Hanoi, 2008.

E N D
The empirical development of a therapeutic formula for the treatment of malnutrition from F100 to therapeutic pastes (RUF). Importance of delivering the full spectrum of micronutrients to acutely malnourished children Michael Golden. MSF satellite meeting, Hanoi, 2008
History of feeding the severely malnourished • 1945: Concentration camps. Used protein hydrolysates – 80% mortality – results supressed by Churchill • 1956: MRC units Jamaica and Uganda. Milk, Sugar, Oil mixes – basically the same recipe only Uganda 100kcal/100ml, Jamaica 135kcal/100ml • 1960 added large amounts of Potassium on per kilo child basis (Alleyne, Garrow et al)
1962 added magnesium (Montgomery et al) • Biafra: K-mix-2 was used, based upon casein, sugar and oil: no mineral or vitamin mix • 1976: development of separate formula (low protein/Na) for initial treatment (Picou-Golden mix = PG-mix) • 1978: Zinc and copper requirements calculated and added (Golden + Golden) • 1982: Other trace element requirements assessed and added to diet. eg Selenium, vitamin E (Golden + Ramdath) • 1983: importance of balance of Anions and Cations recognised to prevent acidosis from mineral salts chosen (particularly Magnesium salt)
1985 recognition of the importance of the type of oil used – EFA deficiency recognized and comparison of diets with coconut and arachis oil on biochemical recovery (Ramdath) • 1986: change from concept of giving nutrients per kilo child to formulation of diet – nutrients per 1000kcal of diet. Allowed for single diet for all instead of treatment tailored for individuals • 1987: development of original F100 diet formulation. Formally tested in Jamaica (Morris + Golden) • 1991: refinement and roll out of F100 and F75 (Started as PG-mix then known as F-TS standing for Formula for toxic shock) at MSF meeting (Golden and Briend). • 1993: Inauguration of ACF Scientific committee • 1993: commercial production of F100 organised by Grellety and made by Nutriset
1994 First use of F100 in Rwanda after genocide. Results revolutionary! Extensive use of F100 and F75 by most NGOs (Grellety) • 1995: refusal of patients in North Uganda to come for treatment (Lord’s Resistance Army kidnapping children) – need for ready-to-use food recognised by Grellety • 1996: ACF scientific committee discussed options and developed the idea of a paste based on premixes seen in Liberia (Golden, Grellety, Briend) • 1997: successful use of local fortified foods for treatment of SAM by ICDDRB (Kituri and Halva)
1997: Briend observed acceptance of “Nutella”and decided to flavour product with peanuts. Resigned from ACF committee and worked with Nutriset to develop products • 1997: “Plumpy-nut” tested in Tchad (Prudhon) with good results • 1998 demonstration by Briend that bacteria do not grow in Plumpy nut and extensive testing in many setting initiated by Briend/Nutriset. • 1999: adoption of F100 and F75 by WHO as standard treatment for SAM
2000 Further extension of treatment to outpatients by Collins and Concern • 2004 Spearheaded by Valid International - use of outpatient management by many NGOs particularly Concern + SCF. Data presented to show dramatic increase in coverage and low mortality • 2006 extension of treatment to moderately malnourished by MSF • 2007: lipid based spreads used to prevent malnutrition at population level in Niger (MSF)
Rational for formulation • Based on development of type 1, type 2 classification of nutrients (published 1988) • Recognition of different requirements for catch-up growth (all forms of weight loss – SAM, MAM, convalescence) from that for normal children • Verified by experimental results (balance studies, growth studies, biochemical studies) in recovering severelymalnourished children in metabolic ward (1956-1990).
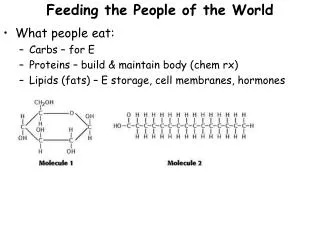
Over 40 nutrients are essential to health • If any one is deficient then the person will not be healthy and resist disease • Many are ignored by doctors and nutritionists and their deficiency is not recognised or corrected • They are divided into two groups in terms of the response to a deficiency
Type 1 Functional nutrients has a body store reduces in concentration with deficiency Specific signs of deficiency Growth failure not a feature variable in breast milk Type 2 Growth nutrients has no body store stable tissue concentration no specific signs of deficiency Growth failure the dominant feature stable in breast milk
Type 1 iron iodine copper calcium selenium thiamin riboflavin pyridoxine niacin folate cobalamin vitamin A, D, E, K Type 2 nitrogen essential amino acids potassium magnesium phosphorus sulphur zinc sodium chloride
Type II nutrients Deficiency of any one leads to the same response • tissue repair and growth ceases • Rapid turnover of tissues vulnerable (enterocyte + some white cell series) • No convalescence from illness • negative balance for all type II nutrients • anorexia (if diet is unbalanced in type II) • growth rate is the dominant determinant of requirement
Muscle biopsy (vastus lateralis) from a malnourished and normal child. Treatment was with an old diet not balanced in type II nutrients Normal child 100% WfH Malnourished <70%WfH Recovered 100% WfH Old HEM diet
growth rate determines requirement of type II nutrients: The example of zinc Weight gain at 15g/kg/d Half lean tissue: half fat tissue Lean tissue contains 0.1 mg/g • Then growth takes 15 x ½ x 0.1= 0.75mg/kg/d • a 6 kg child will need to retain 4.5mg/ d • availability from a good diet is 30% (but less than 15% from a cereal/pulse diet) • dietary intake will need to be 15mg/d RDA for this child is only 5mg/d
Local diets • Briend has shown by linear programming that it is not possible to get the same nutrient concentrations from local diets without fortification with some minerals and vitamins. • The best diets contain a large variety of local foods mixed together • However, addition of mineral and vitamin mix to mixtures of local foods can indeed result in a diet that emulates F100 and derivative diets • There remains the problems of anti-nutrients and the necessity to test new diets against the gold standard (F100/RUTF).
Effect of adding CSB, UNIMIX or family plate to growth of recovering SAM children
Change from CSB to SP450 (roasted oats/dehulled soya + CMV) on wet feeding program outcomes
Conclusions • Malnutrition is mainly due to deficiency in type II nutrients in the diet in an available form • They can be supplied by special products or appropriately fortified and formulated local diets • There is now a major research agenda to further define requirements and develop diets and foods that are cheap enough to be widely used for prevention of malnutrition