Download
1 / 42
420 likes | 709 Vues
How Realistic is Photorealistic?. How Realistic is Photorealistic?. Yaniv Lefel Hagay Pollak. Based on the work of - Siwei Lyu and Hany Farid. Introduction. Among the set of all possible images, natural images only occupy a tiny subspace .

E N D
How Realistic is Photorealistic? Yaniv Lefel Hagay Pollak Based on the work of - Siwei Lyu and Hany Farid
Introduction • Among the set of all possible images, natural images only occupy a tiny subspace. • For instance, there are totally 256^(n^2) different 8-bit grayscale images of size nxn pixels. Natural images are sparsely distributed in the space of all possible images.
Image space • e.g. when n = 10 pixels, it results in 1.3x10^154different images !!!
Introduction (cont’) • The regularities within natural images can be modeled statistically. • Image statistical models are already in use by applicationssuch as:Compression, de-noising, segmentation, texture synthesis, content-based retrieval and object/scene categorization.
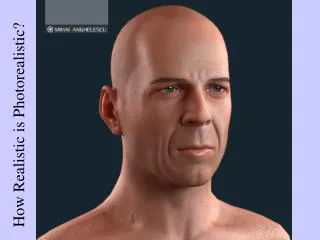
Motivation 1 Identify Computer Graphics • Sophisticated computer graphics software can generate highly convincing photorealistic images able to deceive the human eye. • Differentiating these two types of images is an important task to ensure the authenticity and integrity of photographs.
Motivation 2Identify StegImages • Image steganographyhides messages in digital images in a non-intrusive way that is hard to detect visually. • The task of generic steganalysis is to detect the presence of such hiddenmessages without the detailed knowledge of the embedding methods.
Steganography example Original Steg |Original-Stego| • Steg is the message image embedded into the original image. • The rightmost image is the absolute value of the difference between the original and steg image, normalized into 8 bit for display purposes. message
Motivation 3Identify Re-broadcasting • Biometrics-based (e.g., face, iris, or voice) authentication and identification systems are vulnerable to the “rebroadcast” attacks. (e.g. using a high-resolution photograph of a human face). • We need to differentiate a “live” image (captured in real time by a camera) and a “rebroadcast” one (a photograph).
How to distinuish images ? • Image properties ? • Image intensity histogram • Image frequency Other method ?
Why wavelets • Image representations based on multi-scale image decomposition (e.g., wavelets) decompose an image with basis functions partially localized in both space and frequency - a compromise between these representations.
QMF - Quadrature Mirror Filter • The QMFpyramid decomposition splits the image frequency space into three different scales, and within each scale, into three orientationsubbands (Vertical, Horizontal and Diagonal).
QMF • The vertical, horizontal and diagonal subbands at scale i are denoted by Vi(x; y), Hi(x; y), and Di(x; y), respectively. • Can be generatedby convolving the image, I(x, y), with low-pass and high-pass filters.
Magic Box • Error coefficients Add some magic … Simple but long (and out of scope) mathematical procedure • QMF coefficients
Technique Diagram Feature vector
Computing the Feature Vector • 3 – Sub-bands (vertical, horizontal, diagonal). • 3 – Scales (levels of decompositions). • 4 – First order statistics (mean, variance, skewness – asymmetry measure, kurtosis). • 3 – Colors (RGB) • 2 – marginal statistics (wavelet coefficients), error statistics. • 216 = 3*3*4*3*2
Feature vectors projected on 3D space Natural image – Blue. Synthetic images - noise (Green), fractal (Black), and discs (Red)
Learning and Testing CG\Steg\rebroadcast • CG\steg\rebroadcast images are prepared. • Statistics is collected over natural images and CG\steg\rebroadcast images (not using color). • A Machine learning system (e.g. FLD, LDA, SVM) is then trained on some of the natural and some of the CG\steg\rebroadcast images. • The remaining natural and CG\steg\rebroadcast images are used for testing.
Natural vs. Steganography images • A message consists of a 64x64 pixel region of a random image chosen from the same image database.
Live vs. rebroadcast • We collect statistics from natural images and the same images after having been printed on a laser printer and re-scanned with a scanner (printing and scanning are done at 72 dpi).
Live vs. rebroadcast (cont’) • Remark: It is not surprising that printing significantly disturbs the image statistics. Detecting a rebroadcast image will become more difficult with printers improvement.
Rebroadcasting example Shown is the original iris images (top row) and the images after being printed and scanned (bottom row).
Feature vectors projected on 3D space Results from a four-way classifier of 1000 natural, 1000 steg, 500 graphic, and 200 rebroadcast images.
More Applications how many different artists ?
More Applications Forgery detection.
Finally • Statistical model. • capture regularities that are inherent to photographic images. • Distinguish tampered \ CG images and natural images.