TVA's Integrated Planning Cycle: Navigating Energy Demand and Resource Management
This overview outlines the Tennessee Valley Authority's (TVA) comprehensive planning process, emphasizing the importance of annual forecasting and long-term capacity and resource planning. The process involves critical outputs, including load forecasts, generation, transmission, and financial plans, aimed at meeting future energy demands while ensuring regulatory compliance and financial viability. Key considerations such as peak demand projections, resource alternatives, and environmental impacts are assessed to adapt to changing conditions. The TVA's mission encompasses stewardship and balancing competitiveness with sustainability in its energy strategies.

TVA's Integrated Planning Cycle: Navigating Energy Demand and Resource Management
E N D
Presentation Transcript
System Planning Overview Beth Creel September 22
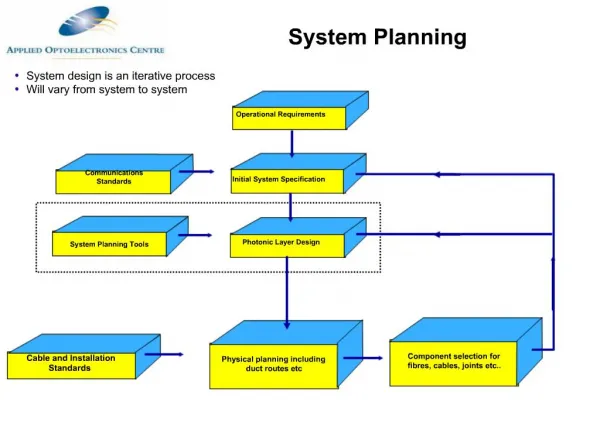
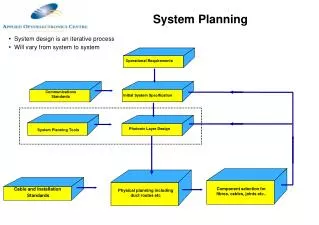
TVA’s Planning Cycle – Part Of A Continuous And Integrated Process TVA Act, Mission, Strategic Plan & Policy Decisions Financial Goals Competitiveness Risk Appetite Stewardship Load Forecast adjustments, etc. - if necessary Planning process consists of five major outputs: - Load Forecast - Capacity Expansion Plan - Generation Plan - Transmission Plan - Financial Plan Financial Plan Transmission Plan Fuel Cost Adjustment Fuel Plans SBU Budgets Revenue Requirements From Long Range Financial Plan Emissions Projections & Costs Generation Plan Rates and TFO Impacts Capacity Expansion Plan “End” Expansion Alternatives “Start” Asset Characteristics- Hydro, FPG, NPG, IPPs, etc. Goal is to produce expected costs and financial impacts to TVA from required capacity and energy needed to meet loads and other requirements Load Forecast Clean Air Planning Environmental Regulatory Outlook Commodity Pricing – Fuel & Electricity Pre-Decisional Work Product - TVA Confidential
The Planning Process • A long-range planning process is a recursive sequence of annual forecasting and planning activities. • Each annual loop through the process produces a plan that schedules supply additions over the long term, with many of the additions scheduled years out in the future. • The decisions we are most concerned with are those that we have to make now. • Some types of supply require quite a bit of time to bring into production, so they must be decided long ahead of when they are needed. Sensitivity/uncertainty analysis makes sure that imminent decisions are not passed. • Decisions to be made in the future, requiring no current action, are noted and studied, but are less important. There is no commitment to follow through on these future “placeholder” decisions. • As conditions change over time, repeated long-range forecasts incorporate the changes, and the plans adjust accordingly. • Over time, some decisions are made and acted on, becoming “fixed” in the portfolio. • The future decisions change as cost and demand estimates change, or as new technologies arrive. • Planning sequentially provides flexibility for plans to adapt as conditions change.
Planners Are Full of Questions… • How much energy will our customers use in the future? • Will we be able to meet the projected energy use? • Are additional resources needed? • What alternatives do we have to meet our resource needs? • What are the transmission implications? • Are there strategic considerations that will limit the alternatives we can consider? • How do we properly evaluate all of these resource alternatives? • How do we find the best solution? • Which plan (portfolio) do we select?
Summary – Key Drivers & Assumptions Pre-Decisional Work Product - TVA Confidential
Forecasting Peak Demand & Annual Consumption • Peak demand projections will drive capacity plan • Growth in peak demand is still expected (at slower rate) • Summer peak remains the critical season for capacity planning • Sales forecast must consider economic uncertainties and different trends among customer classes • Energy growth still projected over the long term but rate of growth is slower than in previous forecasts • Further revisions expected before study begins TVA Summer Peak Demand, MW
Planning for More Than the Summer Peak • Key components in demand/energy forecasting include: • Firm Demand = projected demand (MW) at time of the peak before any adjustments for interruptible contracts or demand side management (DSM) programs • Net Firm Demand = system demand after including the reductions associated with interruptible loads and anticipated DSM peak reduction • Reserve Margin = amount of MW added to net firm demand to account for likely operating and planning contingencies, consistent with applicable regulatory requirements (FERC/NERC), to ensure that the probability of load being unserved is minimized • Firm Requirements = the combination of net firm demand and reserve margin. Capacity planning models develop a portfolio of resources to meet firm requirements over the planning horizon (typically 20 years or longer) • Projecting firm requirements for the capacity planning study will include consideration of uncertainties for these components
Identifying the Capacity Shortfall Capacity shortfall (gap) is the difference between the projected firm requirements and existing firm supply. Existing Firm Supply is the combination of all existing generating resources and budgeted and approved projects and/or power purchase agreements. Capacity planning is typically about seeking the least cost option to close the gap.
Investigate Possible Resource Alternatives • Consider options for new resources if needed: • Conventional generation • Renewables • DSM (EE/DR) • Purchased Power (PPAs) • Collect and validate resource attributes including: • Dependable capacity (at peak) • Capital (installed) cost • Operating characteristics • Maintenance costs • Transmission costs/impacts • Environmental signature • Fuel requirements • Technology maturity/availability • Others…
Expansion Plan Bud10 & Bud09 • Capacity Additions – 2010 Budget Plan • Green bars represent Nuclear units, beginning with EPU at BFN & WBN2 in 2013, BLN1-4 in 2018, 2022, 2026 & 2030, adding ~4700 MW by 2028. • Brown bars represent Coal plants – none added in current plan. • Orange bars represent CCs, beginning with Lagoon Creek in 2010, Northeast TN CC in 2012 and over 4,000 total by 2028. • Blue bars represent CTs, beginning with two plants in 2014, and totaling over 8,000 MWs by 2028. • Yellow bars and pink bars represent market purchases, <60 months and >/=60 months, respectively. • Light blue bars in 2009 budget plan represent DSM programs projecting peak load relief. 1100MW Fleet Capacity Reduction WBN2 Added NECC Added LGCC Added Pre-Decisional Work Product - TVA Confidential