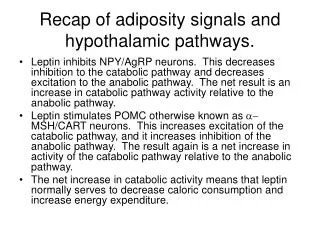
Download
1 / 34
340 likes | 427 Vues
This study explores the impact of socioeconomic status on childhood growth trajectories, focusing on height and adiposity. Using data from birth to ten years, the research reveals that disparities in height are established early on, with greater differentials for girls. While no clear gradient in ponderal index is observed, BMI differentials emerge by maternal education levels from 4 years onwards. The findings emphasize the importance of early interventions to address socioeconomic inequalities in adiposity. Future research will investigate cohort effects and model growth outcomes into puberty.

E N D
Socioeconomic position and trajectories of growth and adiposity across childhood Laura Howe, Social Medicine, University of Bristol
Inequalities in growth and adiposity • Socioeconomic disadvantage is associated with: • Shorter stature • Greater adiposity • Little is known about when the socioeconomic differentials appear
Objectives • Model trajectories of growth across childhood: • Height • Adiposity • Explore how these growth curves differ by socioeconomic position (SEP)
Research questions • Do the overall patterns of growth and adiposity change differ by SEP? • What is the magnitude of socioeconomic differentials at different ages? • Are there gender differences in the patterns of socioeconomic differentials?
Height and weight data in ALSPAC • Birth weights/lengths (obstetric records & ALSPAC staff visiting hospitals) • Routine child health records(health visitors, up to 4 measures per child) • Research clinics (CiF and Focus) • Questionnaires (mother-reports, up to 4 per questionnaire)
Adiposity measures • Ponderal index (kg/m3) for 0-2 years • BMI (kg/m2) for 2-10 years
Analysis 1 • Fractional polynomials to estimate overall shape • Identification of rough spline points • Optimisation of spline points
Analysis 2 • Random effects multi-level models in MLwiN • Individual-level residuals provide an individual’s deviation from the average(intercept and slope for each period) • Interactions with SEP
Results • Overall shapes of curves did not differ by SEP • Spline points were therefore estimated for all SEP groups combined
Height Spline points Boys: 3, 10, 29 months Girls: 2, 11, 32 months
Boys’ mean heights by maternal education By 10 years: 1.4cm difference between highest and lowest groups
Girls’ mean heights by maternal education By 10 years: 1.7cm difference between highest and lowest groups
Ponderal Index Spline points Boys: 2 months Girls: 1, 4 months
BMI Spline points Boys: 56, 67, 73, 79, 105 months Girls: 60, 65, 75, 81, 103 months
Conclusions: Height • Socioeconomic differentials in height are largely established by birth length and growth between 1 and 3 years • Socioeconomic differentials in height are greater for girls than boys • By 6 years-old there is a clear height gradient across all four categories of maternal education for girls. Intermediate education groups remain similar for boys
Implications: Height • Pre-natal and early life factors are the most important determinant of socioeconomic differentials in height
Conclusions: Ponderal Index • There is no clear socioeconomic gradient in ponderal index in the first 2 years of life
Conclusions: BMI • From 4 years onwards, boys whose mothers are educated to degree-level have lower BMI • There is no BMI gradient across other categories of maternal education • From 4 years onwards, girls whose mothers are educated to degree-level have lower BMI • Inequalities are wider in girls, and there is a clearer gradient across all categories of maternal education
Implications: Adiposity • Socioeconomic inequalities in adiposity are established early in childhood • Interventions could be aimed at pre-school and early-school children
Remaining questions • WHY are inequalities wider in girls? • Cohort effects?
Next steps • Variables for ALSPAC archive will be available for all to use • Associations of growth with other childhood outcomes/exposures • Modelling growth later into childhood to include puberty
Acknowledgements • Kate Tilling, Debbie Lawlor, Bruna Galobardes, Paul Clarke, Fiona Steele