Download

1 / 27
270 likes | 477 Vues
Climate Forcing, Sensitivity and Feedback Processes. Earth ’ s Climate System What have we learned?. Earth is a planet Planetary temperature is determined by Brightness of our star Earth-sun distance Albedo of the planet Composition of Earth ’ s atmosphere. Energy In = Energy Out.

E N D
Earth’s Climate SystemWhat have we learned? • Earth is a planet • Planetary temperature is determined by • Brightness of our star • Earth-sun distance • Albedo of the planet • Composition of Earth’s atmosphere Energy In = Energy Out So how can climate ever change?
Earth’s Energy BudgetWhat have we learned? Surface climate depends on heating • 51 units of absorbed solar • 96 units of downward infrared (almost 2x sunshine)! Surface climate depends on cooling • 117 units of upward infrared • 23 units of evaporation, 7 units of rising thermals
John Tyndall, January 1863 Common Sense 1 m • Doubling CO2 would add 4 watts to every square meter of the surface of the Earth, 24/7 • Doing that would make the surface warmer • This was known before light bulbs were invented! 4 Watts 1 m
Common Myth #1 “Scientists are worried about climate change because it’s been warming up recently” WRONG! We’re worried because we know that when we add heat to things, they warm up
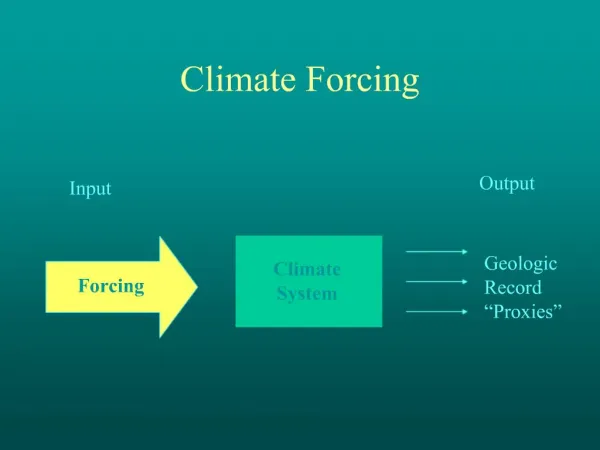
Earth’s Climate as a “Black Box” S0 TS Climate System 1367W m-2 15 C Surface Temperature Out Sunshine In
Climate Forcing, Response, and Sensitivity DS0 DTS Climate System + 1W m-2 ? °C Response: (Change in Surface Temperature) Forcing (change in sunshine)
Climate Forcing, Response, and Sensitivity Forcing (change in sunshine) Response: (Change in Surface Temperature) “Let’s do the math …” A 1 W m-2 change in sunshine would produce about a 0.26 °C change in planet’s temperature
19th Century Climate Physics(Svante Arrhenius, 1896) aS0 esTs4 S0 atmosphere Differentiate, apply chain rule Ts Earth Arrhenius worked out a simple formula for the change in surface temperature given a change in effective atmospheric emissivity due to CO2
19thCentury Climate Physics (cont’d) W m-2 (from satellite data) Plug in measured values Ts = 288 K W m-2 (for 2 x CO2from radiative transfer) For CO2 alone (no feedback), expect about 2 °F warming for 2 x CO2
DTS Dvapor D albedo Climate Feedback Processes • Positive Feedbacks (amplify changes) • Water vapor • Ice-albedo • High clouds D hi cloud D LW D lo cloud DS • Negative feedbacks (damp changes) • Longwave cooling • Low clouds
CO2 and the Ice Ages • Over the past 420,000 years atmospheric CO2 has varied between 180 and 280 ppm, beating in time with the last four glacial cycles CO2 370 ppm in 2000 ice ice ice ice Vostok (400k yr) Ice Core data (Petit et al, 1999)
Estimating Total Climate Sensitivity • At the Last Glacial Maximum (~ 18k years ago) surface temp ~ 5 °C colder • CO2 was ~ 180 ppm (weaker greenhouse, 3.7 W m-2 more LW) • Brighter surface due to snow and ice, estimate 3.4 W m-2 more reflected solar Almost 3x as sensitive as suggested by Arrhenius in 1897 … Other feedbacks must be going on as well
Review: 19th Century Physics(updated using paleo-data) • Forcing: changes in properties of atmosphere as measured by spectroscopy (4 W m-2 per doubling of CO2) • Feedback: both positive and negative, total response to forcing estimated from Ice Age climate data (about 0.7 °C per W m-2) • Response: about 2.8 °C warming for 2 x CO2 No climate models required … just based on observations (modern calculations agree … coincidence?)
CO2 and the Modern Age • Over the past 420,000 years atmospheric CO2 has varied between 180 and 280 parts per million, beating in time with the last four glacial cycles • Since the Industrial Revolution, CO2 has risen very rapidly CO2 400 ppm in 2013 370 ppm in 2000 ice ice ice ice Vostok (400k yr) Ice Core data (Petit et al, 1999) from measurements
Solar Variability • Sun is an enormous spinning plasma sphere (entirely composed of charged particles) • Rotating charges induce intense magnetic fields • Fluid flow follows field (not buoyancy!) • Rapid differential rotation distorts field lines • They wrap and wrap, tighter and tighter • About every 11 years, they break down, reorganize, and start again
Solar Variability • 11-year solar cycle associated with variations in solar “constant” of about 10 W m-2(~ 0.1% of total) • Variability on longer time scales is not understood • Possibly associated with Century-scale variability (“Little Ice Age”)?
Volcanic Aerosol • Massive releases of particles and (more importantly) SO2, lofted to tremendous heights in stratosphere • SO2 -> H2SO4 aerosol in stratosphere • Can persist for months-years • Substantial shift from direct to diffuse light
Volcanic Stratospheric Aerosol • Changes in aerosol optical depth as a result of Mt Pinatubo eruption (June 1991) • Filled tropical stratosphere quickly • Dispersed to all latitudes over ~ 1 yr • Affected climate for 2-3 years?
Stratospheric Aerosol & Temperatures • Big volcanoes dominate variance • What causes trend?
The Past 2000 Years http://commons.wikimedia.org/wiki/File:2000_Year_Temperature_Comparison.png
Historical Thermometer Record http://commons.wikimedia.org/wiki/File:Instrumental_Temperature_Record.png
CO2 and the Future • Over the past 420,000 years atmospheric CO2 has varied between 180 and 280 parts per million, beating in time with the last four glacial cycles • Since the Industrial Revolution, CO2 has risen very rapidly • If China & India develop using 19th Century technology, CO2 will reach 900 ppm in this century CO2 900 ppm in 2100 395 ppm in 2013 ice ice ice ice Vostok (400k yr) Ice Core data (Petit et al, 1999) You ain’t seen nothing yet!