Download
1 / 34
340 likes | 372 Vues
Explore the impact of dust radiative forcing on climate, dust emission modeling, and feedback mechanisms in the atmosphere. Research covers dust transport, emission sources, climate alterations, and feedback dynamics.

E N D
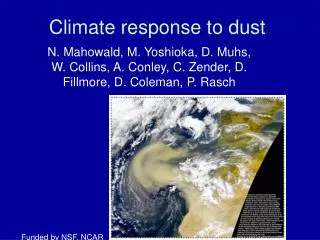
The Climate Response To Dust Radiative Forcing and Its FeedbackUpon the Dust Aerosol Cycle Ron Miller, Reha Cakmur, Jan Perlwitz, Peng Xian Columbia University, New York, NY
Sources of Dust Aerosol Over China Gobi Taklimakan Sun, Zhang, and Liu, J. Geophys. Res., 2001
Desert Dust Is Blown Toward Beijing Where It Mixes With Sulfate Aerosols Created By Industry
Transport of Asian Dust To North America and Europe Finish: French Alps March 6 Start: Taklimakan February 23? • Dust that ascends into the jet stream over the Taklimakan can travel tens of thousands of kilometers downwind. • Chinese dust has been identified in France by trajectory calculations and its isotopic signature. Grousset et al., Geophys. Res. Let., 2003
The Smallest Asian Dust Particles Arrive in Western North America During the Entire Year. Van Curen and Cahill, J. Geophys. Res., 2002
Modeling Dust Emission in an Atmospheric General Circulation Model (AGCM) • Motivation: many fundamental properties of dust (e.g. emission, aerosol mass) are not measured directly, and must be inferred from models constrained by observations. • Wind-tunnel measurements: dust emission E occurs when the surface wind speed w exceeds a threshold wT (w>wT): • Problem: The surface wind speed computed by the AGCM at each grid box represents an average over the grid box, while dust is lifted (emitted) on smaller scales.
The geographic distribution of the smallest, most radiatively active dust particles is controlled by the large-scale circulation that is generally well-represented by an AGCM. Dust is mobilized by intense and localized wind gusts, associated with dust devils, squall lines, and haboobs, that are generally below the resolution of the AGCM. • Challenge: how to simulate dust emission given the low resolution of the AGCM compared to the circulations emitting dust?
Modeling Dust Emission in an AGCM • Assume a distribution of wind speed p(w)dw within each AGCM grid box: • To calculate the distribution parameters, use information calculated by the AGCM planetary boundary layer (PBL) and convective parameterizations about the size of wind speed fluctuations about the grid box value. Cakmur et al., J. Geophys Res., 2004
In the AGCM, dry convective vortices make the biggest contribution to subgrid wind fluctuations. Wind speed fluctuations associated with dry convection are related to the one-third power of the surface sensible heat flux (Cakmur et al., J. Geophys Res., 2004), based upon observations.
Dust Alters Climate Through Radiative Forcing Global Average Surface Forcing: -2.05 Wm-2 Global Average TOA Forcing: -0.12 Wm -2 Dust reduces solar heating of the surface. Reduction of the net incoming flux at the top of the atmosphere (TOA) is much smaller. Miller, Tegen, and Perlwitz, J. Geophys. Res, 2004
Change of Surface Air Temperature By Dust is determined by TOA forcing. • The small TOA forcing causes little change to the upper tropospheric temperature. • Because this temperature is tightly coupled to the surface by deep convection, the surface cools only slightly, despite strong negative forcing at the surface by dust. • Temperature change by dust at the surface is small. Miller and Tegen, J. Climate, 1998
How Does the Surface Respond to Reduced Sunlight Beneath the Dust Layer? The flux of surface sensible heat into the atmosphere is reduced beneath the dust layer. This reduces mixing within the boundary layer. Evaporation is reduced beneath the dust layer. This reduces global precipitation and the removal of dust from the atmosphere by wet scavenging (or wet deposition). This increases the lifetime of dust in the atmosphere: a positive feedback. Miller, Tegen, and Perlwitz, J. Geophys. Res, 2004
How Does Dust Radiative Forcing Change Dust Emission? • Dust emission depends upon the climate (e.g. through the surface wind and rainfall). • Dust changes climate through radiative forcing. • Can dust radiative forcing change dust emission? Are there feedbacks? • Compare dust emission in two model experiments: one with dust radiative forcing, and one without forcing. • If emission is smaller in experiment with forcing, this is a negative feedback.
Dust Emission is Reduced By Forcing at All of the Most Productive Source Locations. The global reduction is 15%.
Wind Speed Anomalies Caused By Dust Radiative Forcing • Surface radiative forcing by dust reduces the AGCM grid box mean wind. • Surface radiative forcing by dust also reduces wind fluctuations within the grid box associated with dry convective mixing.
Emission is Reduced by the Reduction in Wind Speed • Wind fluctuations associated with dry convective mixing cause a slightly larger reduction of emission than the grid box mean wind.
Why Does Dust Surface Forcing Reduce the Surface Wind Speed? • Subgrid wind fluctuations associated with dry convection vary with the one-third power of the surface sensible heat flux. This flux decreases beneath the dust layer due to the reduction of sunlight. PBL mixing is highly correlated with the surface flux of sensible heat into the atmosphere. Reduction of the sensible heat flux reduces the vigor of mixing within the boundary layer, which reduces the transport of momentum to the surface, thus reducing the grid box mean surface wind speed. Miller, Perlwitz, and Tegen, J. Geophys. Res, 2004
Diurnal Cycle of Emission and Wind Speed in the Sahara Desert • Radiation into the surface is reduced beneath a dust cloud, reducing the surface sensible heat flux back into the atmosphere. • This reduces the vigor of mixing within the PBL, which reduces the transport of momentum to the surface, thus reducing the surface wind speed and dust emission. • Reduction in mixing and emission increases with the magnitude of dust radiative forcing.
Diurnal Cycle of Emission and Wind Speed in the Gobi Desert (March-April-May)
The ITCZ Is Displaced Equatorward By Dust Radiative Forcing Solid line: dust forcing Dashed line: no forcing Forcing applied only in summer Hemisphere of Hadley Cell. TOA: -5Wm-2 Surface: -10Wm -2 Xian and Miller, 2005 Dust radiative forcing displaces rain in ITCZ away from dusty region: a positive feedback.
Dust Radiative Forcing Strengthens the Asian Monsoon, Which Increases Arabian Emission. A positive feedback! n.b. SST is prescribed, Miller, Perlwitz, and Tegen, Geophys. Res. Lett., 2004
Given a mixed-layer ocean (with prescribed ocean heat transport), the monsoon is not strengthened by dust and Arabian emission decreases. Miller, Perlwitz, and Tegen, Geophys. Res. Lett., 2004
How does ocean heat transport respond to dust radiative forcing? • If the reduction of sunlight beneath the dust layer is balanced by ocean heat convergence, then evaporation need not decrease. • Atmospheric radiative heating by dust can strengthen the monsoon) without opposition. Which result is correct?
Conclusions • Surface air temperature is reduced by dust radiative forcing at the top of the atmosphere. • Reduction of sunlight beneath a dust layer reduces evaporation, weakening the hydrological cycle. The surface sensible heat flux into the atmosphere is also reduced, weakening boundary layer mixing. • By weakening boundary layer mixing, surface radiative forcing by dust reduces both the AGCM (resolved) wind and the magnitude of subgrid wind fluctuations. This is a negative feedback upon dust emission. Questions • Can surface radiative forcing be positive? Then PBL feedback upon emission would be positive. This depends upon longwave optical properties of large (supermicron) particles. • How does dust radiative forcing change ocean heat transport? Can the reduction of sunlight beneath the dust layer be balanced without a reduction in evaporation?
Radiative Forcing of Climate: 1850-2000 Soil Dust Radiative forcing is defined as the change in the net incoming radiation at the top of the atmosphere. Hansen et al. (Proc. Nat. Acad. Sci, 2001)
Variations in Global Radiative Forcing Since 1880 Based upon measured and modeled changes in atmospheric composition and solar output.
Dust in ModelE • Preferred source regions: A. Ginoux source (Ginoux et al. 2001, JGR). B. Tegen source (Tegen et al. 2002, JGR). C. Zender source (Zender and Newman, 2003, JGR). D. Another Zender source (Grini et al, 2005, JGR) • Emission by subgrid wind speed distribution (Cakmur et al. 2004, JGR). • Vegetation mask: European Remote Sensing (ERS) microwave scatterometer (sensitive to surface roughness) (Pringent et al. 2005, JGR). • GISS modelE AGCM (Schmidt et al. 2004, JGR). A. 4° x 5°, 20 layer (10 in troposphere with 0.1mb top). B. No dust radiative forcing (diagnostic only). C. Forced by observed SST 1997-2001: 5 years mean.
Size of Subgrid Fluctuations in Wind Speed • Calculate a typical scale of wind variation associated with three meteorological systems that raise dust: • Stirring within the PBL due to surface drag and convective mixing (wp). • Dry convective thermals created by solar heating of the surface (wd). • Gust fronts created by downdrafts along the advancing edge of thunderstorms (wm). • Equate size of variability s to either: • sum: (constructive addition) or • root-mean square: (random addition). • How is the dust AOT changed? • Which process contributes most to subgrid emission?
What Is Global Annual Emission of Dust? • Uncertainty in the effect of dust on climate is proportional to uncertainty in emission. • Emission observations are limited to a few locations and times. There are no routine global data measurements. • Emission is estimated indirectly by modeling the load (e.g.) and tuning with respect to observations. (Inverse approach.) • In recent models, dust emission varies by over a factor of 2 (800-2000 Tg/y). Cakmur et al., J. Geophys. Res., 2005; Miller et al., J. Geophys. Res., 2005
Total Model Error (All Data) • Optimal value annual emission depends upon assumed source: Ginoux ~ 1600 Tg (1200-2100) Tegen ~ 2600 Tg (1500-4100) Zender1 ~ 2300 Tg (1000-4600) Zender2 ~ 2300 Tg (1300-3800)