Sequence Alignment and Phylogeny
This detailed guide delves into the essential uses of sequence alignments in bioinformatics, including pairwise alignment, searching for homologues, and evaluating protein families. It discusses the concepts of homology, orthology, paralogy, and xenology, alongside methods for measuring sequence similarity like Hamming and Levenshtein distances. The significance of substitution matrices (PAM and BLOSUM) in assessing protein evolution and the selection of appropriate matrices for various tasks are examined. Gain insights into how these methodologies contribute to understanding evolutionary relationships in biological data.
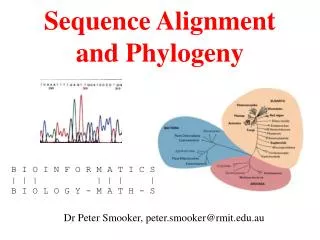

Sequence Alignment and Phylogeny
E N D
Presentation Transcript
Sequence Alignment and Phylogeny B I O I N F O R M A T I C S | | | | | | | B I O L O G Y - M A T H - S Dr Peter Smooker, peter.smooker@rmit.edu.au
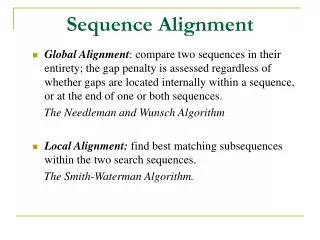
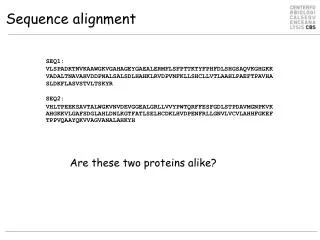
Uses of alignments • To determine the relationship (ie: distance) between two sequences (pair-wise alignment) • To search databanks for the presence of homologues • To look for sequence conservation in families of proteins • To use molecular approaches to phylogeny
Comments/Caveats • When sequences are aligned, we assume they share a common ancestor • Protein fold is more conserved than protein sequence • DNA sequences are less informative than protein sequences • Two sequences can always be aligned- we need to determine what is a meaningful result
Homology • Proteins or genes are defined as homologous if they can be said to have shared an ancestor • Genes or proteins are either homologs or they are not- there is no such thing as percent homology. There ispercent identity or similarity of the sequences
“Ologies” • Homology - descent from a common ancestor • Orthology - descent from a speciation event • Paralogy - descent from a duplication event • Xenology - descent from a horizontal transfer event
When Is Homology Real? • As a general rule, in a pairwise alignment: >25% identical aa’s, proteins will have similar folding pattern- most likely homologous 18-25% identical- twilight zone- tantalizing <18% identical- cannot determine from alignment
Measuring Sequence Similarity • Two measures of the distance between two strings: • Hamming distance: strings equal length, number of positions with mismatches • Levenshtein distance: not equal length, number of edit operations to change one string to the other
agtc Hamming distance = 2 cgta ag-tcc Levenshtein distance = 3 cgctca
Protein Alignments-Substitution Matrices • When sequences diverge over time, they accumulate mutations- some are deleterious, some are neutral, some are advantageous • Some changes are more likely than others • This can be examined and the relative probability of a change occurring calculated • Substitution matrices have been developed
Matrices. • PAM = Percent Accepted Mutation • Matrices are derived from families of proteins with a set level of identity. • PAM matrices proposed by Margaret Dayhoff. Based on sequences with > 85% identity. The PAM 1 matrix was computed. Extrapolated for larger evolutionary distances
PAM Matrices PAM 0 30 80 110 200 250 % identity 100 75 50 60 25 20 • The PAM250 matrix is corresponds to proteins of average 20% identity (lowest we can reasonably be confident about). It was derived by the extrapolation of observed substitution frequencies. PAM250 refers to 250 substitutions per 100 amino acids.
Definition of PAM from BLAST literature • http://www.ncbi.nlm.nih.gov/BLAST/tutorial/Altschul-1.html • One "PAM" corresponds to an average change in 1% of all amino acid positions. After 100 PAMs of evolution, not every residue will have changed: some will have mutated several times, perhaps returning to their original state, and others not at all. Thus it is possible to recognize as homologous proteins separated by much more than 100 PAMs. Note that there is no general correspondence between PAM distance and evolutionary time, as different protein families evolve at different rates.
BLOSUM Matrices • Developed by S and JG Henikoff • Made use of a much larger amount of data • Based on the BLOCKS database of aligned protein domains • http://www.blocks.fhcrc.org/ • Used a weighted average of closely related sequences with identities higher than a threshold. For example, the common BLOSUM62 matrix is based on proteins with greater than 62% identity
BLOCKS • The substitutions in each aligned column are identified and a score for each substitution calculated and inserted into the matrix.
Which Matrix to use? • In BLASTP, the following matrices are offered: • PAM 30 • PAM 70 • BLOSUM 80 • BLOSUM 62 (default) • BLOSUM 42 • In PAM, greater numbers = more evolutionary distance. Reverse for BLOSUM
Which Matrix to use? • Generally, BLOSUM perform better than PAM for local alignment searches • Use the matrix appropriate for the task- if you expect a close match, use a low PAM or high BLOSUM number • Generally, if you use the default (generally BLOSUM 62) and find nothing, go to a matrix derived from a more evolutionarily distant dataset
Scoring Score of mutation i > j log observed i >j expected i > j Expected i > j is simply calculated by the frequencies of the amino acids Result is multiplied by 10. Scores are added.
PAM250 A R N D C Q E G H I L K M F P S T W Y V A 2 R -2 6 N 0 0 2 D 0 -1 2 4 C -2 -4 -4 -5 4 Q 0 1 1 2 -5 4 E 0 -1 1 3 -5 2 4 G 1 -3 0 1 -3 -1 0 5 H -1 2 2 1 -3 3 1 -2 6 I -1 -2 -2 -2 -2 -2 -2 -3 -2 5 L -2 -3 -3 -4 -6 -2 -3 -4 -2 2 6 K -1 3 1 0 -5 1 0 -2 0 -2 -3 5 M -1 0 -2 -3 -5 -1 -2 -3 -2 2 4 0 6 F -4 -4 -4 -6 -4 -5 -5 -5 -2 1 2 -5 0 9 P 1 0 -1 -1 -3 0 -1 -1 0 -2 -3 -1 -2 -5 6 S 1 0 1 0 0 -1 0 1 -1 -1 -3 0 -2 -3 1 3 T 1 -1 0 0 -2 -1 0 0 -1 0 -2 0 -1 -2 0 1 3 W -6 2 -4 -7 -8 -5 -7 -7 -3 -5 -2 -3 -4 0 -6 -2 -5 17 Y -3 -4 -2 -4 0 -4 -4 -5 0 -1 -1 -4 -2 7 -5 -3 -3 0 10 V 0 -2 -2 -2 -2 -2 -2 -1 -2 4 2 -2 2 -1 -1 -1 0 -6 -2 4
Scores below 0 indicate amino acids that are rarely substituted, and different aa’s that give a high +ve score are usually functionally equivalent • Scores below 0 indicates that those substitutions are rarely observed
These aa’s are hydrophobic (except glycine, often put in a class by itself).
Significance • Two values are given- the Bit score and the E-value. • The E-value is a statistical calculation of the probability that the match is real, ie: that in a query database of that size, the sequence would give that score by chance • The bit score is related to both the raw score (calculated from the BLOSUM or PAM lookup matrix) but is normalised
Bit Score • Bit scores are normalised with respect to the scoring system. Hence they can be compared across different searches (using different matrices) • In particular: To convert a raw score S into a normalized score S' expressed in bits, one uses the formula S' = (lambda*S - ln K)/(ln 2), where lambda and K are parameters dependent upon the scoring system (substitution matrix and gap costs) employed
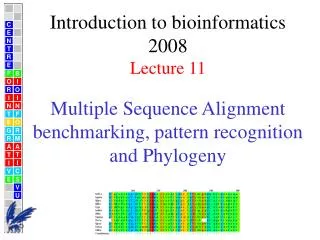
Multiple Sequence Alignment • To quote Lesk • “One amino acid sequence plays coy; a pair of homologous sequences whisper; many aligned sequences shout out loud”
Multiple Sequence Alignment • Multiple sequence alignments can offer a considerable amount of information over a pairwise alignment. • Regions of similarity (especially distant similarity) can be detected • Regions of functional significance can often be detected • Evolutionary relationships can be examined, and trees drawn.
MSA’s are computationally expensive • If we use dynamic programming, rather than a 2D array as for pairwise comparison, have an n-dimensional array. Computational time grows as Mn, where n is the number of sequences. Difficult for n=4, impossible for higher values. • Use a heuristic approach. Most common is the CLUSTAL algorithm
Progressive Alignment • Iterative pairwise alignment • Two most similar sequences aligned first, then next most similar to that pair, etc. • A very popular progressive alignment algorithm is CLUSTAL W
CLUSTAL W- Steps • A matrix of pairwise distances between all sequences is constructed. This determines the similarity between all sequences to be aligned. • A guide tree (dendogram), or inferred phylogeny, is built • The alignment is constructed based on the guide tree. • Generally results in a near-optimal alignment
CLUSTAL W • A major problem in MSA is the selection of an appropriate matrix for alignments consisting of divergent and closely related sequences • CLUSTAL W (weighted) assigns weights to a sequence dependent on how divergent it is from the two most closely related sequences • Adapts gap penalties and scoring matrix to suit
An example (from our research) • Some definitions: • Phylogeny: Evolutionary history (“tree of life”) • Molecular phylogeny: Determined using sequence data • Bootstrapping: A statistical process to evaluate phylogenetic trees. The data is resampled 1000 times (generally) and the support for each branch determined • Homology modelling. Predicting the structure of a protein based on the experimentally derived structure of a homologue
Fasciola- Liver Fluke NEJ Adult
Liver fluke (Fasciola spp.) • Trematode (flatworm) parasite • Infects ruminants, humans • Has a complex life-cycle • Secretes proteins (excretory/secretory material) • Major secreted protein is cathepsin L in adults
Cysteine proteases • Digest proteins: cleave between adjacent amino acids. • Not random cleavage, different proteases show a preference for different targets.
There are a number of Fasciola cathepsin L sequences known. • At least 30 full sequences now known • Only one contains an indel • Protein sequences 46-99% identical
What are the differences between the two classes of CatL that account for the substrate specificity? Presumed to be due to changes affecting the S2 subsite of the enzyme.
Homology Modelling • FhCatL modelled on the known crystal structure of human CatL. • Models of CatL2 and CatL5 (functional equivalent of CatL1) compared, especially around the S2 subsite of the enzyme.
Homology Modelling • Three substitutions is residues lining the S2 subsite were observed (L5-> L2) • L69Y: Makes substantial contacts with the P2 Phe • N161T: Side chain points away from pocket • G163A: Bottom of pocket, no substantial contact with P2 Phe
L2 L5 GRASP electrostatic surface potential The architecture around the S2 pocket is substantially influenced by a Y or L at position 69. Made mutant, expressed in yeast, performed kinetic analysis.
Conclusions • The L69Y change does affect the substrate specificity • 69Y allows increased catalysis of substrates with a P2 proline • There are other, more subtle changes between L5 and L2
FgCatL1-a 61 GNMGCSGGLMENAYEYLKQFGLETESSYPYTAVEGQCRYNRQLGVAKVTDYYTVHSGSEV 120 FgCatL1-b GNYGCMGGLMENAYEYLKQFGLETESSYPYTAVEGQCRYNRQLGVAKVTDYYTVHSGSEV FgCatL1-c GNFGCNGGLMENACEYLKRFGLETESSYPYRAVEGPCRYNKQLGVAKVTGYYMVHSGDEV FgCatL1-d GNHGCGGGYMENAYEYLKHSGLETDSYYPYQAVEGPCQYDGRLAYAKVTDYYTVHSGDEV FgCatL1-e GNYGCMGGLMENAYEYLKQFGLETESSYPYTAVEDQCRYNRQLGVAKVTDYYTVHSGSEV FgCatL1-f GNNGCRGGLMEIAYEYLRRFGLEIESTYPYRAVEGPCRYDRRLGVAKVTGYYIVHSGDEV FgCatL2 GNMGCSGGLMENAYEYLKQFGLETESSYPYTAVEGQCRYNRQLGVAKVTDYYTVHSGSEV FgCatL3 GNINCMGGLMENAYEYLKQFGLETESSYPYTAVEGQCRYNRQLGVAKVTDYYTVHSGSEV FhCatL1 GNNGCGGGLMENAYQYLKQFGLETESSYPYTAVGGQCRYNKQLGVAKVTGYYTVQSGSEV FhCatL2 GNYGCGGGYMENAYEYLKHNGLETESYYPYQAVEGPCQYDGRLAYAKVTGYYTVHSGDEI FhCatL3 GNNGCSGGLMENAYQYLKQFGLETESSYPYTAVEGQCRYNKQLGVAKVTGYYTVHSGSEV FhCatL4 GNYGCNGGLMENAYEYLKRFGLETESSYPYRAVEGQCRYNEQLGVAKVTGYYTVHSGDEV FhCatL5 GNYGCNGGLMENAYEYLKRFGLETESSYPYRAVEGQCRYNEQLGVAKVTGYYTVHSGDEV FhCatL6 GNYGCMGGLMENAYEYLKQFGLETESSYPYTAVEGQCRYNRQLGVAKVTDYYTVHSGSEV FhCatL7 GNYGCGGGYMENAYEYLKHNGLETESYYPYQAVEGPCQYDGRLAYAKVTGYYTVHSGDEI FhCatL8 GNHGCGGGWMENAYKYLKNSGLETASYYPYQAVEYQCQYRKELGVAKVTGAYTVHSGDEM FhCatL9 GNNGCSGGLMENAYEYLKRFGLETESSYPYRAVEGQCRYNEQLGVAKVTGYYTVHSGSEV FhCatL10 GNHGCGGGWMENAYKYLKNSGLETASDYPYQGWEYQCQYRKELGVAKVTGAYTVHSGDEM ** .* ** ** * :**:. *** * *** . *:* .*. ****. * *:**.*:
Fasciola CatL’s form a monophyletic clade • Fasciola sequences aligned to the family of papain-like cysteine proteases • 100% bootstrap support for clade • All Fasciola sequences arose after divergence from Schistosoma • Probably all parasitic catLs have diverged after speciation (Sajid and McKerrow)
Relationship of Fasciola enzymes • Tree constructed using 18 full-length sequences • Resolved into 4 distinct clades
AA69 Predicted Substrate L69 Phe-Arg L69 Phe-Arg Y69 Pro-Arg W69 ??-Arg
Evolutionary Timeframe • First observed divergence (clade A) 135 MYA • F. hepatica and F. gigantica predicted to diverge approx. 19 –25 MYA • Confirmed by constructing a neighbour-joining tree using Glutathione-S transferase sequences: 19 +/- 5.2 MYA