WT 35S:amiR-SlMYB12
10 likes | 179 Vues
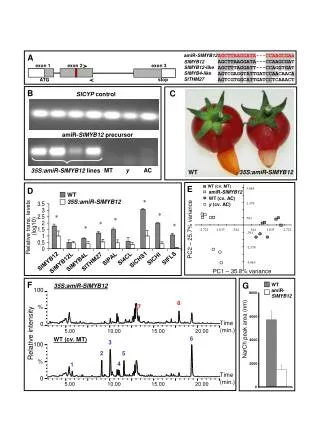
amiR- SlMYB12. A. SlMYB12. exon 1. exon 2. exon 3. SlMYB12-like. SlMYB4-like. SlTHM27. stop. ATG. B. C. SlCYP control. amiR- SlMYB12 precursor. MT y AC. 35S:amiR-SlMYB12 lines. WT. 35S:amiR-SlMYB12. 3,965. E. WT (cv. MT). D. amiR -SlMYB12. WT

WT 35S:amiR-SlMYB12
E N D
Presentation Transcript
amiR-SlMYB12 A SlMYB12 exon 1 exon 2 exon 3 SlMYB12-like SlMYB4-like SlTHM27 stop ATG B C SlCYP control amiR-SlMYB12 precursor MT y AC 35S:amiR-SlMYB12 lines WT 35S:amiR-SlMYB12 3,965 E WT (cv. MT) D amiR-SlMYB12 WT 35S:amiR-SlMYB12 2,379 WT (cv. AC) * y (cv. AC) 793 * * WT amiR- SlMYB12 -2,722 -1,633 -544 544 1,633 2,722 * -793 * Relative trans. levels (log10) * * PC2 – 25.7% variance -2,379 -3,965 SlFLS Sl4CL SlPAL SlCHI SlCHS1 SlMYB12 SlTHM27 SlMYB4L SlMYB12L PC1 – 35.8% variance F G 35S:amiR-SlMYB12 100 8000 8 7 % 6000 5.00 10.00 15.00 20.00 Time (min.) 0 NarCh peak area (nm) Relative intensity 6 WT (cv. MT) 3 4000 100 2 5 % 4 1 2000 5.00 10.00 15.00 20.00 Time (min.) 0 0