Cholera
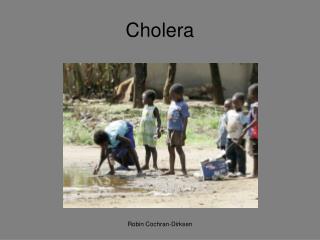
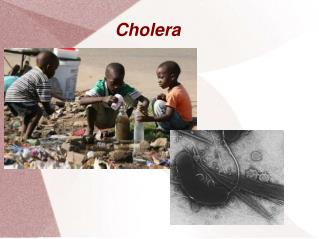
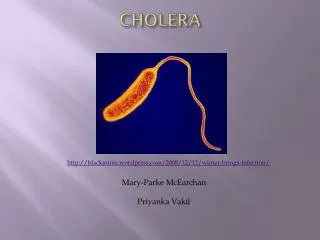
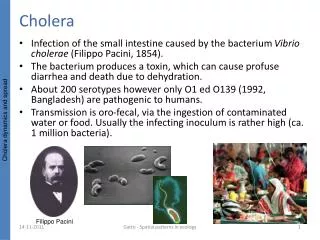
Cholera. Infection of the small intestine caused by the bacterium Vibrio cholerae (Filippo Pacini, 1854). The bacterium produces a toxin, which can cause profuse diarrhea and death due to dehydration. About 200 serotypes however only O1 ed O139 (1992, Bangladesh) are pathogenic to humans.

Cholera
E N D
Presentation Transcript
Cholera • Infection of the small intestine caused by the bacterium Vibrio cholerae (Filippo Pacini, 1854). • The bacterium produces a toxin, which can cause profuse diarrhea and death due to dehydration. • About 200 serotypes however only O1 ed O139 (1992, Bangladesh) are pathogenic to humans. • Transmission is oro-fecal, via the ingestion of contaminated water or food. Usually the infecting inoculum is rather high (ca. 1 million bacteria). Cholera dynamics and spread Filippo Pacini Gatto - Spatial patterns in ecology
Distribution of cholera in space and time Cholera dynamics and spread 3-5 million cases; 100-120,000 deaths Gatto - Spatial patterns in ecology
Cholera characteristics • Main reservoirs: water, humans • Incubation period: 2 hours-5 days • 75% of infectives are asymptomatic, but produce bacteria in fecal excretions for 7-14 days • Within symptomatics (25% ), only 20% develop acute symptoms with watery diarrhea and dehydration • Recovery time: about 5 days • Immunity: • acquired by infectives (symptomatic and asymptomatic) • not permanent, lasts a few years (2-5 ?) Cholera dynamics and spread Gatto - Spatial patterns in ecology
Epidemiological models of cholera Capasso, V. & Paveri Fontana, S. 1979 Mathematical model for the 1973 cholera epidemic in the European Mediterranean region. Rev. Epidemiol. Santé Publique 27, 121–132. Codeço, C. T., 2001 Endemic and epidemic dynamics of cholera: the role of the aquatic reservoir. BMC Infectious Diseases 1, 1. Susceptibles Infected Recovered/ immune Cholera dynamics and spread deaths Bacteria in aquatic habitat Gatto - Spatial patterns in ecology
The importance of space Cholera dynamics and spread Gatto - Spatial patterns in ecology
Epidemiological models in spatial networks Cholera dynamics and spread Hydrological network Hydrological network + human mobility network Gatto - Spatial patterns in ecology
The spatial model Cholera dynamics and spread Set of coupled ODE’s Si = Susceptibles in node i Ii= Infected Bi = Bacteria Pij = hydrological connection matrix Qij = human mobility matrix Crucial parameters: mobility rate, contact rate, contamination rate Gatto - Spatial patterns in ecology
South Africa: the epidemics of Kwazulu-Natal Epidemics between 2000-2002 Cholera dynamics and spread 135,000 cases E. Bertuzzo, S. Azaele, A. Maritan, M. Gatto, I. Rodriguez-Iturbe, A. Rinaldo 2008 “On the Space-time Evolution of a Cholera Epidemic” Water Resources Research, 44, W01424 Gatto - Spatial patterns in ecology
Kwazulu-Natal: disease diffusion between river catchments The role of mobility, demography, social and hygienic conditions Cholera dynamics and spread L. Mari, E. Bertuzzo, L. Righetto, R. Casagrandi, M. Gatto, I. Rodriguez-Iturbe, A. Rinaldo “Modeling cholera epidemics: the role of human mobility and sanitation conditions” Journal of the Royal Society – Interface, published online 13 July 2011 Gatto - Spatial patterns in ecology
Kwazulu-Natal: the double network Mobility, gravitational model Hydrological network Cholera dynamics and spread Sewage Drinking water Space-dependent contact and contamination rates Gatto - Spatial patterns in ecology
Kwazulu-Natal: model performance Cholera dynamics and spread Gatto - Spatial patterns in ecology
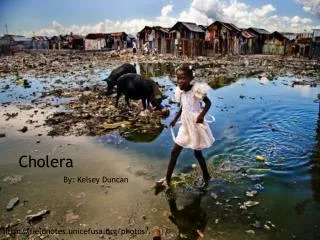
Haiti cholera epidemics Cholera dynamics and spread Situation at end of March 2011 271,000 reported cases (3% of total population) 145,000 hospitalizations (53% of total cases) 4,770 deaths (1.8% of total cases) source:PAHO Gatto - Spatial patterns in ecology
Haiti simplified model: one network Population density Diffusion network Cholera dynamics and spread 560 communities (4th administrative level) fitted to data up to Dec. 2010 E. Bertuzzo, L. Mari, L. Righetto, M. Gatto, R. Casagrandi, M. Blokesch, I. Rodriguez-Iturbe, A. Rinaldo “Prediction of the spatial evolution and effects of control measures for the unfolding Haiti cholera outbreak” Geophysical Research Letters, 2011, Vol. 38, L06403 Gatto - Spatial patterns in ecology
Model calibration and forecast Cholera dynamics and spread Gatto - Spatial patterns in ecology
Intervention strategies • Oral vaccination • Antibiotic treatment • Sanitation: safe drinking water, sewage treatment, etc. Cholera dynamics and spread Gatto - Spatial patterns in ecology
Intervention strategies: model scenarios Cholera dynamics and spread 300,000 people vaccinated from Jan. 1st 3,000,000 people vaccinated from Nov. 1st 40% water treated from Jan. 1st 40% water treated from Nov. 1st Gatto - Spatial patterns in ecology
Recent cholera revamping Cholera dynamics and spread Situation as of October 26, 2011 Reported cases: 485,092 Deaths: 6712 Gatto - Spatial patterns in ecology
The advanced model Cholera dynamics and spread • New Model accounting for • the two networks • loss of immunity • water contamination due to heavy rainfall Gatto - Spatial patterns in ecology