Statistics PSY302 Quiz Chapters 2
260 likes | 281 Vues
Statistics PSY302 Quiz Chapters 2. 1. The mean, mode and median are examples of measures of:. The middle Central Tendency Variability A & B All of the above. 1. The mean, mode and median are examples of measures of:. The middle Central Tendency Variability A & B All of the above.

Statistics PSY302 Quiz Chapters 2
E N D
Presentation Transcript
1. The mean, mode and median are examples of measures of: • The middle • Central Tendency • Variability • A & B • All of the above
1. The mean, mode and median are examples of measures of: • The middle • Central Tendency • Variability • A & B • All of the above
2. The Mean is sometimes represented by: • The @ sign • The Greek letter Sigma Σ • The letter Mu (μ) • X • All of the above
2. The Mean is sometimes represented by: • The @ sign • The Greek letter Sigma Σ • The letter Mu (μ) • X • All of the above
2. The Mean is sometimes represented by: • The @ sign • The Greek letter Sigma Σ • The letter M • X • All of the above
3. The Mean of these four numbers is: • 1 • 2 • 3 • 4 • 5 • 5 • 4 • 3 • 8
3. The Mean of these four numbers is: • 1 • 2 • 3 • 4 • 5 • 5 • 4 • 3 • 8
4. An _____ is the one value that represents an entire group of scores. • Raw score • Individual score • Average • mode • Maximum value
4. An _____ is the one value that represents an entire group of scores. • Raw score • Individual score • Average • mode • Maximum value
5. A frequency distribution tells us all the values a variable can take and : • The mode • Why the data are skewed • The frequency of each value • Which category each one belongs in • All of the above.
5. A frequency distribution tells us all the values a variable can take and : • The mode • Why the data are skewed • The frequency of each value • Which category each one belongs in • All of the above.
6. Height, income, age, percent correct on the final are examples of ____ data. • Categorical • Nominal • Ordinal • Quantitative • All of the above
6. Height, is an example of ____ data. • Categorical • Nominal • Ordinal • Quantitative • All of the above
7. An example of categorical data is • John is a sophomore • Mellody has a 3.21 GPA • Tyrone has completed 48 hours • Ulrike weighs 121 pounds • All of the above
7. An example of categorical data is • John is a sophomore • Mellody has a 3.21 GPA • Tyrone has completed 48 hours • Ulrike weighs 121 pounds • All of the above
8. Use the ____ to determine the middle when you have extreme scores and you don’t want to distort the average. • Median • Mean • Mode • Standard Deviation • All of the above
8. Use the ____ to determine the middle when you have extreme scores and you don’t want to distort the average. • Median • Mean • Mode • Standard Deviation • All of the above
9. Use the ___ as a measure of central tendency when the data are categorical in nature and values can fit only into one class. • Median • Mean • Mode • Standard Deviation • All of the above
9. Use the ___ as a measure of central tendency when the data are categorical in nature and values can fit only into one class. • Median • Mean • Mode • Standard Deviation • All of the above
10. Use the ___ as a measure of central tendency when you have data that do not include extreme scores and are not categorical. • Median • Mean • Mode • Standard Deviation • All of the above
10. Use the ___ as a measure of central tendency when you have data that do not include extreme scores and are not categorical. • Median • Mean • Mode • Standard Deviation • All of the above
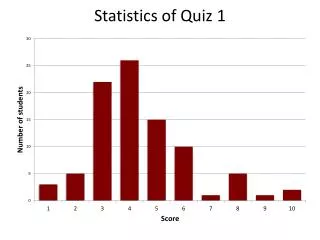
Bonus question. The frequency distribution below is an example of: • Positively skewed data • Negatively skewed data • Normally distributed data.
Bonus question. The frequency distribution below is an example of: • Positively skewed data • Negatively skewed data • Normally distributed data.
Freshman less than 22 • Sophomore 22-53 • Junior 54-86 • Senior 87 or more.