Labor Force Distribution Among Major Countries: Analysis and Standard Deviation
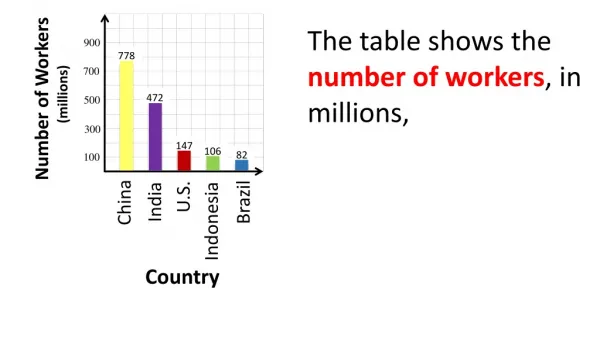
This analysis presents the number of workers (in millions) across the five countries with the largest labor forces: China, India, the U.S., Indonesia, and Brazil. The total labor force is highlighted as 778 million for China, 472 million for India, 147 million for the U.S., 106 million for Indonesia, and 82 million for Brazil. Additionally, we calculate the standard deviation to evaluate the variability within these figures, using a determined mean of 317 million. This study aids in understanding workforce distribution and its statistical implications.

Labor Force Distribution Among Major Countries: Analysis and Standard Deviation
E N D
Presentation Transcript
Number of Workers (millions) The table shows the number of workers, in millions, 778 472 147 106 82 China India U.S. Indonesia Brazil Country
Number of Workers (millions) The table shows the numberofworkers, in millions, for the five countries with the largest labor forces. 778 472 147 106 82 China India U.S. Indonesia Brazil Country
Number of Workers (millions) The table shows the numberofworkers, in millions, for the five countries with the largest labor forces. 778 472 147 106 82 China India U.S. Indonesia Brazil Find the standard deviation. Country
Number of Workers (millions) The table shows the numberofworkers, in millions, for the five countries with the largest labor forces. 778 472 147 106 82 China India U.S. Indonesia Brazil Find the standard deviation. Country
Number of Workers (millions) The table shows the numberofworkers, in millions, for the five countries with the largest labor forces. 778 472 147 106 82 China India U.S. Indonesia Brazil Find the standard deviation. Country
Number of Workers (millions) The table shows the numberofworkers, in millions, for the five countries with the largest labor forces. 778 472 147 106 82 China India U.S. Indonesia Brazil Find the standard deviation. Country
Number of Workers (millions) The table shows the numberofworkers, in millions, for the five countries with the largest labor forces. 778 472 147 106 82 China India U.S. Indonesia Brazil Find the standard deviation. Country
Number of Workers (millions) The table shows the numberofworkers, in millions, for the five countries with the largest labor forces. 778 472 147 106 82 China India U.S. Indonesia Brazil Find the standard deviation. Country
Number of Workers (millions) The table shows the numberofworkers, in millions, for the five countries with the largest labor forces. 778 472 147 106 82 China India U.S. Indonesia Brazil Find the standard deviation. Country
The mean is 317. Now find by how much each of the five data items differs from 317.
The mean is 317. Now find by how much each of the five data items differs from 317.
The mean is 317. Now find by how much each of the five data items differs from 317.
The mean is 317. Now find by how much each of the five data items differs from 317.
The mean is 317. Now find by how much each of the five data items differs from 317.
The mean is 317. Now find by how much each of the five data items differs from 317.
Add the squared deviations. Totals:
Add the squared deviations. Totals:
Add the squared deviations. Totals:
Add the squared deviations. Totals:
Add the squared deviations. Totals:
Divide the sum by n – 1 Totals:
Divide the sum by n – 1 Totals:
Divide the sum by n – 1 Totals:
Divide the sum by n – 1 Totals:
Divide the sum by n – 1 Totals:
Divide the sum by n – 1 Totals:
Divide the sum by n – 1 Totals:
Divide the sum by n – 1 Totals:
Divide the sum by n – 1 Totals:
Divide the sum by n – 1 Totals:
Divide the sum by n – 1 Totals:
Divide the sum by n – 1 Totals:
Divide the sum by n – 1 Totals: