Iowa
The U.S. Corn/Soybean Belt. N. Dak. Minn. Wisc. S.Dakota. Mi. Iowa. Nebr. Ohio. Ill. Ind. Mo. Kansas. Ky. 83% of U.S. corn & soybeans are grown outside Iowa. Grain Market Setting. 2002-03: U.S. corn supply down 7 %, processing up 211 mil. bu., exports down 139 m. b.

Iowa
E N D
Presentation Transcript
The U.S. Corn/Soybean Belt N. Dak.. Minn. Wisc. S.Dakota Mi. Iowa Nebr. Ohio Ill. Ind. Mo. Kansas Ky. 83% of U.S. corn & soybeans are grown outside Iowa
Grain Market Setting 2002-03: • U.S. corn supply down 7%, processing up 211 mil. bu., exports down 139 m. b. • foreign feed gr.prod’n down 504 mil. bu. • U.S. Soybean supplies down 6%, S. Am. +460 mil. bu. after +247 mil. Y/A • U.S. soybean use to be cut 6% • EU, Japan ban on meat meal feeding • GMOs: still some concern • 2002-crop: more corn acres needed?
Fundamental Analysis • Key Concepts • How Freedom to Farm Has Changed Fundamental Analysis • Analyzing Supply • Analyzing Export Demand • Analyzing Domestic Demand • Seasonality • Some Key Web Sites • Current Examples
9/23/02 quotes in white The time dimension in prices 3/05/02 Closing prices 3/31/03 March 2.03 May 02 2.10 2.37 July 02 2.17 2.37 Sept. 02 2.23 2.38 2.31 2.40 Dec. 02 2.54 July 03 2.66 2.39 2.51 Dec. 03 2.46 2.49 2.42
2.48 Land set-asides before FTF 2.00
SOURCES OF SUPPLY SOURCES OF SUPPLY INFORMATION INFORMATION • USDA: Farmer surveys & aerial photos – for stocks & production • Census reports (Exports, Mill stocks) • Checks from processing & exports (wheat & soybeans) (production + stocks + imports – utilization = ending stocks) 4. USDA Objective yield plots & surveys
OTHER SOURCES OF DATA OTHER SOURCES OF DATA • Monthly USDA crop forecasts • Weekly crop & weather bulletin • Census exports & processing reports • National Oilseed Processors Association • Private crop forecasts • USDA World S-D Reports • USDA Weekly Export Inspections • Weekly price support activity
Export Sales & Shipments 9/01-3/20/03 Vs. a Year Earlier • Corn -12% Japan+11%, Korea -83%,Taiwan -6%, Mexico +11%, Canada +91%, Egypt -45%, other Asia & Ocn. -74% • Soybeans +2% • SB Meal -17% • SB Oil -2%
FORECASTING FEED USE FORECASTING FEED USE OF CORN OF CORN Key Variables: • Grain-consuming animal numbers • Availability of substitutes v U.S. feed wheat v Grain sorghum Barley v Corn quality v Livestock marketing weights v Livestock/crop price ratio v Time trend (incl. New technologies) v
Forecasting U.S. Corn Yields • Yield: The biggest uncertainty in the Supply-Demand equation • Corn Yield: 5% below trend for 2003 cuts potential production 500 mil. bu. • 10% above trend in 2002 would add 1,015 mil. bu. to supply • Price implications: Large
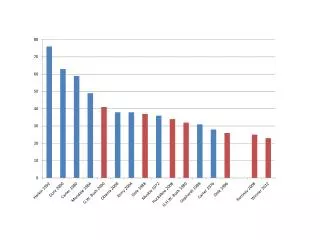
FORECAST VS. ACTUAL U.S.CORN YIELD 150 140 130 Actual 120 BU./ACRE 110 100 Forecast 90 80 1987 1989 1991 1993 1995 1997
Corn Price ForecastingMarch 31, 2003 for 2003-04: Meth. I, Normal U.S. yield • Price Elasticity of Demand: -0.5 • 1% Change in Supply = 2% Change in Price • 2003-04 Supply up 11% vs. 2002-03 • Adjustment for Demand Increase: +100 Mil. Bu., or 8% net increase in supply • Forecast U.S. Season Avg. Price: $2.13/Bu. • Balance Sheet forecast: $2.10 (Adjustment for China uncertainty& historical stocks/use)
Forecasting Model Result Meth. II, normal yields • Coefficients: • Exports/Supply 1.46 • Stocks/use -0.76 • Weather variable 0/1 • Loan rate $1.98 • Prev. Price 2.32 • Wheat Price 2.60 • Forecast 2003-04 U.S. avg. corn price $2.13. Freedom-to-farm adjust. = $0.03
Soybean Price Forecasting • 1% change in supply brings 2.5% change in avg. price, all else constant • 2003-04 U.S. supply up 4% or 113 mil. bu. • World demand growth: +430 mil. bu. • Foreign production +480 mil. bu. • Net chg. for U.S. supply: 113+480-400 = 163 mil. bu. or 6% increase Price: 6x2.5=-15%, gives $4.60/Bu.
Brazil Cerados Typical dirt road in Brazil during the beginning of the dry season.