IOWA
Sources and Flux of Nitrate-Nitrogen in the Cedar River, Iowa, Chad Fields Iowa Geological Survey - IDNR. IOWA. Cedar River. 90% of Iowa’s land is dedicated to agriculture. More than agricultural issues: Des Moines Lobe Shallow Bedrock Industry Size. Reason for study.

IOWA
E N D
Presentation Transcript
Sources and Flux of Nitrate-Nitrogen in the Cedar River, Iowa, Chad FieldsIowa Geological Survey - IDNR
IOWA Cedar River • 90% of Iowa’s land is dedicated to agriculture
More than agricultural issues: • Des Moines Lobe • Shallow Bedrock • Industry • Size
Reason for study • The Cedar River is used as a drinking water source for the City of Cedar Rapids, Iowa. • As such, nitrate concentrations in the Cedar River are regulated by the EPA. • <10 mg/L as N.
Must exceed certain EPA guidelines for (usually) concentration)… In this case – nitrate-N -On 303(d) – impaired waterbody list-
TMDL - Total Maximum Daily Load • “Greatest amount of pollutant a waterbody can receive without exceeding the water quality standard.” • Usually based on concentration (10 mg/L). • Usually a % reduction from one, or multiple sources.
TMDL Equation Load = ‘Point’ + ‘Background’ + ‘Nonpoint’ + Margin of Safety Modeled -DAFLOW -WASP Regulated Wastewater- NPDES Permits ‘Natural’ -Septic -Wildlife -Wet Dep. -Dry Dep. Agriculture -Row Crop -Fertilizer -Manure -Septic Safety buffer -Concentration decrease
Modeling • Two different models: • DAFLOW for discharge • WASP for nitrate • 4-year time span for each model • Important (fundamental) facts about models: • Only as good as what you put in them. • Only good for that moment in time.
DAFLOWWater Model Input Point Modeled Point
WASP model • Calculates concentrations of nitrate in the stream/lake/pond • User inputs given concentrations • Ambient monitoring • Snapshots • NAQWA monitoring • Cedar Rapids monitoring • Can incorporate processes such as instream algal uptake, mineralization, denitrification, etc. • Not used in this model (lack of data).
Model Results – Entire Cedar • Discharge = 2,683,908 ac-ft/yr • Nitrate-N load = 28,561 tons/yr • Watershed contribution = 13.7 lbs/ac/yr • Daily mean concentration = 6.1 mg/L
TMDL Equation Load = ‘Point’ + ‘Background’ + ‘Nonpoint’ + Margin of Safety Modeled -DAFLOW -WASP Regulated Wastewater- NPDES Permits ‘Natural’ -Septic -Wildlife -Wet Dep. -Dry Dep. Agriculture -Row Crop -Fertilizer -Manure -Septic Safety buffer -Concentration decrease
Method • Total nitrogen sources (all nitrogen deposited has an equal chance of converting to nitrate in Cedar River). • Most nitrogen travels downstream as nitrate • Point sources 1:1 ratio with nitrate load • Nonpoint and background = load – point sources
TMDL Equation Load = ‘Point’ + ‘Background’ + ‘Nonpoint’ + Margin of Safety Regulated Wastewater- NPDES Permits ‘Natural’ -Wildlife -Wet Dep. -Dry Dep. Agriculture -Row Crop -Fertilizer -Manure -Septic Safety buffer -Concentration decrease Modeled -DAFLOW -WASP
Deposition – NADP and CASTNET • From the National Atmospheric Deposition Program Quarterly loads (kg/ha) inorg. N 1990’s - present
Wildlife • Deer population studies: • From Iowa DNR • 0.05 lbs N/deer/day * 2 (for all wildlife)
TMDL equation Load = ‘Point’ + ‘Background’ + ‘Nonpoint’ + Margin of Safety Regulated Wastewater- NPDES Permits ‘Natural’ -Wildlife -Wet Dep. -Dry Dep. Agriculture -Row Crop -Fertilizer -Manure -Septic Safety buffer -Concentration decrease Modeled -DAFLOW -WASP
Septic Systems • Septic loads = rural population * average nitrate load/person • Rural population from 2000 census • Average nitrate load/person. • From Nassau, 1981 • 4.5 kg nitrate-N/person/year
Agricultural • Manure, fertilizer and legume nitrogen levels from MWPS, 2002. • Countywide data • 2002 landuse estimates • Confined Feeding Operation (CAFO) permits
TMDL Load Calculation • June 13, 2003 modeled flow and measured nitrate concentration • 14.66 ppm NO3 • TMDL Concentration (w/ 5% MOS) = 9.5 ppm NO3 • 35% reduction
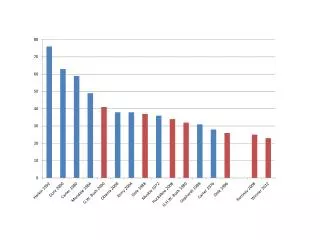
Reduction Scenario *NA = not applicable (no reduction)
Other possibilities-processes • Best management practices to change the form of nitrogen. • Organic N
Conclusions • Rowcrop agriculture is the primary source of nitrate in the Cedar River. • Reduction of fertilizer, manure inputs could decrease nitrate levels. • Changing land use will also have a significant impact. • Conversion of nitrate to organic N would help decrease nitrate-N concentrations.