Download
1 / 82
830 likes | 987 Vues
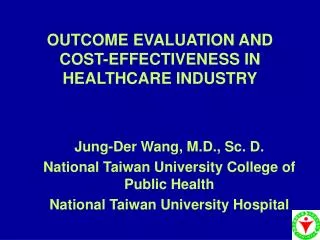
OUTCOME EVALUATION AND COST-EFFECTIVENESS IN HEALTHCARE INDUSTRY. Jung-Der Wang, M.D., Sc. D. National Taiwan University College of Public Health National Taiwan University Hospital. OUTLINES.

E N D
OUTCOME EVALUATION AND COST-EFFECTIVENESS IN HEALTHCARE INDUSTRY Jung-Der Wang, M.D., Sc. D. National Taiwan University College of Public Health National Taiwan University Hospital
OUTLINES • Introducing the needs and concepts of survival, quality of life (QOL), and quality-adjusted survival as final outcome indicators with QALY (quality-adjusted life year) as a common unit for risk/outcome evaluation and cost-effectiveness • Extended to psychometric measurement for QOL and clinical decision making • Integration with medical cost to the NHI • Increased value for the spending of NHI (Cost-effectiveness)
Evidence based medicine: • There is no room for spending money on ineffective diagnosis and treatment for any medical condition. • Quality assurance, safety, and efficacy for all medical managements. • Find the real causes and effects for all studies and practices • Minimize the cost and share with all colleagues
Redefining health care (2006):by Michael Porter and Elizabeth Teisberg • Value is the health outcomes per dollar spent in providing services.Outcomes are multidimensional, and include not only survival but extent of recovery or disability, errors, complications, recovery time, recurrences, and other aspects of the patient’s health experience. (Cost-effectiveness)
Healthcare reformed:Outcome-based pricing system • McCain: Reform of Medicare to make bundled payments for episodes of care and to pay on the basis of outcomes • Obama: Payment of providers on the basis of performance and outcomes (Oberlander J. The Partisan Divide — The McCain and Obama Plans for U.S. Health Care Reform. New Engl J Med 2008:359: 781-4)
What are the outcomes in health care industry? • Exposure • Internal dose => target organ dose • Early biological indicators, e.g., blood pressure, HbA1c, creatinine, ALT, AST, cholesterol, A/G, chromosome aberration, sister chromatid exchange, etc. • Impairment of organ-systems (hemiplegia, acute myocardial infarction, etc.) • Functional disability (ADL, iADL, etc.) • Change of quality of life or patient reported outcomes • Survival vs. mortality
Why do we need to assess QOL and survival ? • All the intermediate indicators (exposure, dose, early biological indicators, diagnosis of illness or impairment, functional disability, etc.) must be demonstrated to have direct link with these final outcome indicators: • Change of quality of life or patient reported outcomes • Survival vs. mortality
Significance of final outcome indicators • Intermediate outcome indicators are useful for early proactive and/or reactive prevention of poor final outcomes • All kinds of intermediate outcome indicators must validate or establish their relationships with the final outcomes, or, survival and quality of life and the combination of them • Final outcome indicators provide evidence of evaluation for every healthcare products along the same metric
Preventive Measures (NEJM2008;358:661-3) • Haemophilus influenzae type b vaccination of toddlers Cost-saving • One-time colonoscopy screening for colorectal cancer in men 60-64yr of age Cost-saving • Newborn screening for medium-chain acyl-coenzyme A dehydrogenase deficiency $160/QALY • High-intensity smoking-relapse prevention program, as compared with a low-intensity program $190/QALY • Intensive tobacco use prevention program for 7th and 8th graders $23,000/QALY
Treatments for Existing Conditions • Cognitive-behavioral family intervention for patients with Alzheimer’s disease Cost-saving • Cochlear implants in profoundly deaf children Cost-saving • Combination antiretroviral therapy for HIV-infected patients $29,000/QALY • Liver transplantation in patients with primary sclerosing cholangitis $41,000/QALY • Implantation of cardioverter defibrillators in appropriate populations, compared with medical management alone $52,000/QALY
Environmental and Occupational Health Risk Assessment • For sustainable development, we always want to reduce health risk or replace toxic substances by a less toxic compound. But how do you compare nephrotoxicity with hepatotoxicity? • Procedures of risk assessment involve:Hazard identificationExposure assessment Dose-response function Risk characterization Can we compare different types of risks?
Cost-effectiveness is necessary to make the National Health Insurance more sustainable under limited resources • Priority is given from a high to a low cost per unit of benefit or health • How can we measure health ? • Is there any common unit in measuring health ?
A common question raised: • Is there a common unit to measure both the survival and utility or psychometry of quality of life? • Live vs. Dead ---- counting the no. of lives saved • More delicate measures: --Length of survival S(t) or S(ti|xi) --Quality of life Qol(ti|xi) • Can we measure S(ti|xi) or Qol(ti|xi)? • Can we develop a method to combine both? • (Can we quantify the cost paid by the NHI? )
Concepts, Ethics, Measurementand Applications Edited by Christopher J.L. Murray, Joshua A. Salomon, Colin D. Mathers and Alan D. Lopez Summary Measures of Population HealthWHO 2002 http://www.who.int/publications/smph/en/
Global and Regional Burden of Disease Attributable to Selected Major Risk Factors Edited by Majid Ezzati, Alan D. Lopez, Anthony Rodgers and Christopher J.L. Murray Comparative Quantification of Health Risks- WHO2004 http://www.who.int/publications/cra/en/
Estimated survival function, mean QOL and quality adjusted survival curve; The area under the QAS curve is the expected quality adjusted survival time (Hwang JS, et al Statistics in Medicine 1996;15:93-102)
Notation of a typical life table with added columns of QOL (quality of life) and QAST (quality adjusted survival time)
A more general model: • xi:determinant(s) of S(survival) and U(utility) functions e.g. head injury, stroke,….., etc. • Quality adjusted survival Qol(t| xi): quality of life function (Wang JD. Basic principles and practical applications in epidemiological research. 2002)
Cost of illness approach: • Human capital left over for determinant xi WA(t| xi): work ability function • Direct medical cost of determinant xiCost(t| xi): medical cost function
ILLUSTRATIVE EXAMPLES: • How much utility of health (in QALY) does it cost for a case of end stage renal disease or liver cancer? • --- Survival curve • --- Quality of life estimation --- General population of Taiwan in 1995 as the reference population assuming QOL=1
Observed survival rates for the patients with HCC stratified by treatment groups
Table Concentration ranges of the tested volatile organic compounds (VOCs) in groundwater samples collected from 52 civilian wells around a closed electronics-manufacturing factory.Lee LJH, et al. (J Toxicol Environ Health 2002;65:219-35)
*MCLG: Maximum Contaminant Level Goal †MCL: Maximum Contaminant Level
RISK: LIKELIHOOD OF EVENT (Incidence rate or probability) X CONSEQUENCE OF EVENT (loss of utility due to the event) (need to establish a cohort to estimate)
Cancer risks based on RME (reasonable maximal exposure) and cancer slopes Vinyl chloride QALM 8.4 x 10⁻⁶ (X233.6 .002 Tetrachloroethylene QALM) = 1.9 x 10⁻⁴ .044 Trichloroethylene 1.4 x 10⁻⁴ .032 IF there are 1000 people at risk, then the above numbers must be multiplied with 1,000
Extrapolation of survival under high censored rate: Semi-parametric modeling (Hwang & Wang 1999, Fang et al. 2007) Total Hazard Background Hazard H (t | patient) = H (t | reference) + constant excess hazard C1 age- and gender-matched logit W(t) = ln [exp (C0 – C1 × t)/(1 – exp (C0 – C1 × t))] = C0 – C1 × t – ln [1 – exp (C0 – C1 × t)] Because C1 > 0, the residual item ln [1 – exp (C0 – C1 × t)] will converge to 0 when t. As a result, when t, logit W(t) will approximate to C0 – C1 × t , which is a straight line with a slope of – C1.
AIDS group 3-year survival extrapolated to 6 years Non-AIDS group 3-year survival extrapolated to 6 years
Patients under hemodialysis adjusted for quality of life measured by standard gamble
Liver group Life expectancy : 3.45 years Loss of life expectancy : 15.61 years Health gap : 81.9%
Breastgroup Life expectancy : 20.01 years Loss of life expectancy : 9.35 years Health gap : 31.8%
表2 國人罹患一項癌症後將可能造成之預期壽命損失與健保系統治療將給付之估計金額
* 預估在4%醫療服務膨脹率下,以2%折現率之折現值。
WHOQOL (World Health Organization Quality of Life Questionnaire): • Concepts:Individual perception of their position in life in the context of culture and value systems in which they live and in relation to their goals, expectations, standards and concerns
WHOQOL (continued): • WHOQOL-BREF (24 facets, 4 domains, 26 questions)physical psychological cross-culturally social consistent environmental
Domains and facets of Taiwan version of WHOQOL questionnaire (Facet 25 and 26 are new ones developed from Taiwan version) • Overall quality of life and health • Physical DomainF 1. pain and discomfortF 2. energy and fatigueF 3. sleep and restF 9. mobilityF10. activity of daily livingF11. dependance on medicine treatmentF12. working capacity
Domains and facets of Taiwan version of WHOQOL questionnaire (continued) • Psychological DomainF 4. positive feelingF 5. thinking, learning, memory and concentrationF 6. self-esteemF 7. bodily image and appearanceF 8. negative feelingsF24. spirituality/religion/personal beliefs
Domains and facets of Taiwan version of WHOQOL questionnaire (continued): • Social RelationshipsF13. personal relationshipsF14. social supportF15. sexual activityF25. be respected/be accepted
Domains and facets of Taiwan version of WHOQOL questionnaire (continued): • Environmental DomainF16. physical safety and securityF17. home environmentF18. financial resourcesF19. health and social care: availability and qualityF20. opportunities for acquiring new information and skills
Domains and facets of Taiwan version of WHOQOL questionnaire (continued): • Environmental Domain (continued)F21. participation in and opportunities for recreation /leisureF22. physical environment: (pollution/noise/traffic/climate)F23. transportF26. dietary
Quality of life of epilepsy patients(Liu HH, et al. Epilepsy Res 2005) * p < 0.05 ** p < 0.005
Quality of life in obese patients (Chang CY et al. Obesity Surg 2008) * p < 0.05 ** p < 0.005