GRAPHING MOTION NOTES #4 Reading Position-Time and Speed-Time Graphs
330 likes | 624 Vues
GRAPHING MOTION NOTES #4 Reading Position-Time and Speed-Time Graphs. INPUT.

GRAPHING MOTION NOTES #4 Reading Position-Time and Speed-Time Graphs
E N D
Presentation Transcript
GRAPHING MOTION NOTES #4 Reading Position-Time and Speed-Time Graphs
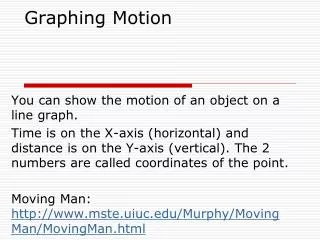
INPUT We can describe the motion of an object by looking at a graph. Graphs make motion easier to picture and understand. The slope of the line means different things on a position-time graph and a speed-time graph. We must always study the independent and dependent variable s on the x and y axis to know how to read a graph. MAKE SURE YOU ALWAYS READ THE LABELS!
Definitions • Speed: tells us the rate at which an object moves. • Acceleration: tells us the rate that speed or direction changes.
How are the Position-Time and Speed-Time graphs different? • Position vs. Time Graph • X-axis: time • Y-axis: position (distance) • Slope: speed Remember: speed (r) = distance/time
How are the Position-Time and Speed-Time graphs different? • Distance vs. Time Graph Time is always plotted on the x-axis. (The further to the right, the longer the time from the start). Distance is always plotted on the y-axis. (The higher up the graph, the further from the start).
How are the Position-Time and Speed-Time graphs different? • Speed vs. Time Graph • X-axis: time • Y-axis: speed (velocity) • Slope: acceleration Acceleration = speed time
How are the Position-Time and Speed-Time graphs different? • Speed vs. Time Graph Time is always plotted on the x-axis. (The further to the right, the longer the time from the start) Speed or Velocity is always plotted on the y-axis. (The higher up the graph, the faster the object is going)
How do we read the graph? Distance v. Time • Time is increasing to the right, but its distance doesn’t change. • It is NOT MOVING! • We say it is at rest.
How do we read the graph? Speed v. Time • A straight horizontal line on a speed-time graph means that speed is constant. It does NOT mean that the object is not moving.
How do we read the graph? • Distance v. Time • Time is increasing to the right, and distance is increasing constantly with time. The object moves at constant speed.
How do we read the graph? • Speed v. Time The graph shows increasing speed. The moving object is accelerating.
How do we read the graph? • Distance v. Time A steeper line (like the dotted line) means that the object is going faster. A less steep line means that it is going slower.
How do we read the graph? • Speed v. Time Both lines show increasing speed to the same top speed. The steeper line (dotted) gets to that speed faster, so it has greater acceleration.
How do we read the graph? • Distance v. Time A negative slope means that the object is moving back to the start.
How do we read the graph? • Speed v. Time A negative slope means that the object is decreasing its speed. This means the moving object is decelerating.
How do we read the graph? • Distance v. Time • The line graph curving upwards shows an speeding up since the line is getting steeper. • The dotted line curving downward shows the object is slowing down.
How do we read the graph? • Speed v. Time The line curving upwards shows the object is accelerating slowly. The dotted line curving downward shows the object is accelerating quickly.
OUTPUT Distance v Time Graph • Tells us how far an object has moved with time • The steeper the graph, the faster the speed • A horizontal line means the object is not moving • A negative slope means the object is returning to the start. Label the graph below with the motion of the object: Stopped then Speeding up until constant speed Fast constant speed Stopped Going back to the start at constant speed Slower Constant speed
OUTPUT Speed v Time Graph • Tells us how fast an object has moved with time • The steeper the graph, the faster the acceleration • A horizontal line means the object is moving at a constant speed. • A downward sloping line means the object is slowing down. Label the graph below with the motion of the object: Accelerating (Speeding up) Slowly Constant Speed Decelerating (slowing down) Quickly Accelerating (speeding up) Quickly
60 50 40 No Acceleration SPEED (miles/hour) Acceleration 30 Deceleration Deceleration 20 Acceleration No Acceleration 10 5 1 2 4 6 8 12 10 Time (hr)
Alp d'Heuz & Lance!
60 50 40 SPEED miles/hour 30 20 10 5 1 2 4 6 8 12 10 Time (hr)
60 Lance starts the race by leaving the starting line and reaching 35 mi/hr within a few minutes. 50 40 30 Miles/hour 20 10 5 1 2 4 6 8 12 10 Time (hr)
60 Lance stays at 35 mi/hr for just under 2 hours before the mountain. 50 40 SPEED miles/hour 30 20 10 5 1 2 4 6 8 12 10 Time (hr)
60 Lance reaches the base of Alp d’Heuz. He quickly goes up the mountain at 15mi/hr for 3 hours. 50 40 SPEED miles/hour 30 20 10 5 1 2 4 6 8 12 10 Time (hr)
60 50 40 SPEED miles/hour 30 20 Lance finally makes it to the top and enjoys a 30 minute downhill at 55mi/hr. 10 5 1 2 4 6 8 12 10 Time (hr)
60 Lance reaches the finish line thrilled and stops. The yellow jersey is his! 50 40 SPEED miles/hour 30 20 10 5 1 2 4 6 8 12 10 Time (hr)
60 50 40 No Acceleration Constant Speed SPEED miles/hour Acceleration 30 Deceleration Deceleration 20 Acceleration No Acceleration Constant Speed 10 5 1 2 4 6 8 12 10 Time (hr)
120 110 100 90 80 70 Position (miles) 60 50 40 30 20 10 12 10 2 4 6 8 Time (hr)