Download
1 / 16
160 likes | 366 Vues
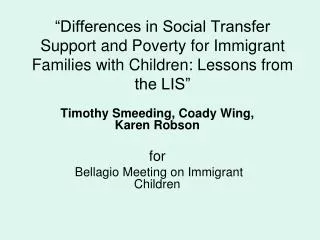
“Differences in Social Transfer Support and Poverty for Immigrant Families with Children: Lessons from the LIS”. Timothy Smeeding, Coady Wing, Karen Robson for Bellagio Meeting on Immigrant Children. Introduction.

E N D
“Differences in Social Transfer Support and Poverty for Immigrant Families with Children: Lessons from the LIS” Timothy Smeeding, Coady Wing, Karen Robson for Bellagio Meeting on Immigrant Children
Introduction LIS offers the possibility to compare ‘immigrants’ and ‘minorities’ to majorities in several nations for at least one time period (circa 2000) . How much help do less advantaged groups get from social tax-benefit programs and from their own market incomes in rich nations ?
Working hypothesis: The country where ‘immigrants’ (minorities) live is more important than their legal (majority-minority/immigrant) status in determining net social benefits (cash and near cash) and poverty status. If supported, then countries can make a difference for immigrant child well being –at least in income support
Research Questions • Migrants come to countries for work, but if something goes wrong, what do countries look like in terms of overall poverty and program effects on minority and immigrant groups—how do they fare ? • How big are differences across groups within nations as compared to across nations? • Unanswered: how about education and healthcare?
Methods • Relative poverty at 50 percent median • Market Income (MI) vs. Disposable Income (DPI) • Net social benefits (cash and near-cash transfers in minus direct taxes paid) • No count health or education benefits • Define ‘immigrant’ and-or ‘minority’
Meaning of ‘Minority’ or ‘Immigrant’ in LIS data • US, France, Canada : ‘Born outside country’ • Germany, Sweden: ‘‘Non-national” • Australia: ‘Not Australian’ • UK: ‘Non-white or minority ‘(with many categories of ethnicity) • Belgium, Spain, Ireland, Austria, Belgium, Greece, Portugal, Italy : ‘Multiple nationality’ • Finland: ‘Swedish speaking’ (HA!)
Idiosyncrasies • EU-ECHP (old and bad for this purpose ) vs. EU-SILC (birth, nationality,--but not here yet) • Native American blacks not counted as minority in this go around • Naturalized vs. not (data question in only surveys ) • Documented vs. not (sampling question and response rate question ) • Our decision: press on but be careful
Literature : Sparse • Lots out there on earnings and second vs. first generation minorities • Lots on labor market effects of immigrants • Lots on ‘rhetoric’ of pull back of welfare state benefits in face of immigration • BUT not much hard evidence on how cash welfare state reacts to immigrants in across country context
Results: How About Poverty and Program Effects for ‘Immigrant’ vs. ‘Majority’? • Minority -Majority Poverty Rates (Table 2) • Overall System Effects: Majority Kids (Figure 4a)vs.Minority Kids (Figure4b) • Majority vs. Minority Poverty Reduction for all Households with Kids : Last Figure
Percent Reduction in Child Poverty: Immigrants vs. Majorities 100 90 80 Belgium Finland Italy (e) Sweden Austria 70 France Ireland (e) 60 England 50 Immigrant Children 40 Australia Portugal (e) Germany 30 Spain Canada 20 Greece 10 United States 0 0 10 20 30 40 50 60 70 80 90 100 MajorityChildren Countries in red use the echp
Results So Far Majority minority poverty rates and welfare state treatment differ by nation, but biggest differences are across nations and not within nations USA looks bad in most all comparisons, especially compared to Canada and Australia, but mainly because of weak welfare state- not because they mistreat immigrants in particular
What is left to do? LOTS Support for hypothesis that destination country more important than minority-immigrant status in determining poverty status –will it hold up? Definitions of immigrant inconsistent and needing more exploration More work needed here: EU-SILC; age of kids , parental mix, etc Really need comparable assessments for education and health care systems
What to Lobby For ALL ADULTS: Were you born in this country (Y or N) ? If no, when did you migrate ? ALL CHILDREN : Were your children born in this country (Y or N)? If no, where were they born and when did they come?