Download
1 / 25
250 likes | 479 Vues
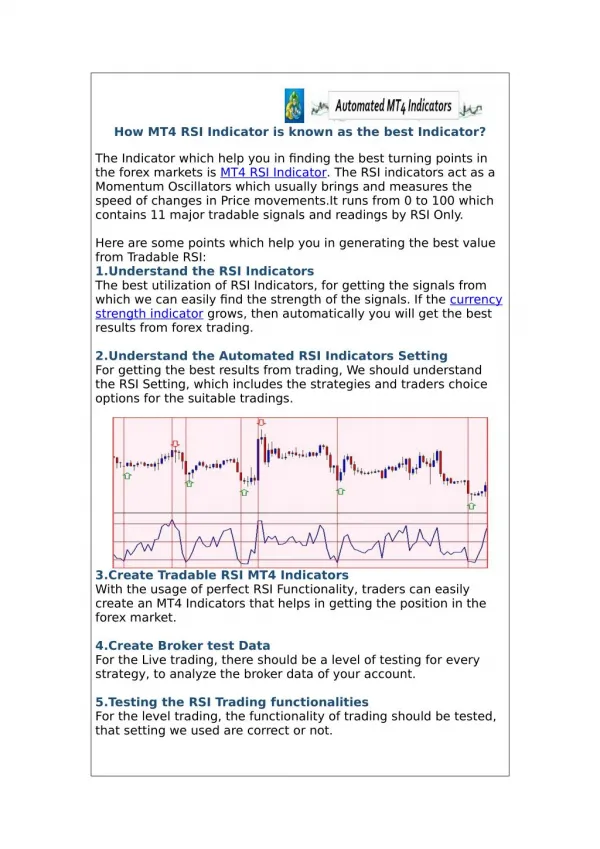
Solving the Riddle That Is APR Indicator 3. Including analysis and self-help tools for coordination with Section 618: Table 6. Presentation Goals. To enhance understanding of the meaning behind the APR reports and what information is needed to properly analyze them

E N D
Solving the Riddle That Is APR Indicator 3 Including analysis and self-help tools for coordination with Section 618: Table 6
Presentation Goals • To enhance understanding of the meaning behind the APR reports and what information is needed to properly analyze them • To provide state personnel with clarified instructions on how to properly complete the data analysis behind the Indicator • To enhance state by state APR reporting similarity • To clarify the similarities and differences between the APR and Table 6 sets of data and to show shortcuts between the two sets
APR and Table 6 of 618 – Trail of History APR 03-04 (looks a lot like Table 6) SPP 04-05 (new format) SEPARATE 04-05 Table 6 APR 05-06 through 07-08 Table 6 attached! X
Why Is This Important? • Table 6 Provides the Backbone to APR Indicator 3 (Most states fill out their Section 618 report first) • OSEP needs the data from both these sources so that it has a clear picture of Participation and Performance in States • National Summary by Content, Type of Assessment, and Grade are important
What do the data tell us? We know how difficult your job as data managers can be!!!
Instructions – 07-08 • AYP • # of districts meeting the State’s AYP objectives for progress for the disability subgroup divided by the total # of districts meeting minimum “n” size • Participation • Sub-indicators for Regular Assessment (both with and without accommodations), and Alternate Assessment (both AA-GLAS, and AA-AAS) • Performance • Sub-indicators for Regular Assessment (both with and without accommodations), and Alternate Assessment (both AA-GLAS, and AA-AAS)
General Instructions Data Source: • Data source is assessment data collected for purposes of determining AYP (Your states NCLB assessment) • Data should be provided for all grade levels and content areas tested • Data MUST be provided in raw numbers in addition to percentages (separate tables work very well!!!) • Participation and performance data to be taken from data collected for reporting under section 618 (Annual Report of Children Served); Table 6 (Section 618) is to be attached to this APR.
General Instructions • Sampling from State’s 618 data is not allowed. • States should use the same assessments used for reporting under NCLB. • States must meet AYP targets in both content areas to be counted as having made overall AYP (NEED overall number). • States must attach Table 6 of their 618 submission. Participation and proficiency calculations in this APR report must report participation and proficiency rates by content area for each of the grades shown in Table 6. • States should EXPLAIN (not just describe) the results of the calculations and compare the results to their target. • States are encouraged to present their APR information in summary tables and include multiple years of data for comparison purposes.
Indicator 3A - AYP • This number is intended to show the percentage of districts in your state that are making Adequate Yearly Progress • To do this, districts must meet AYP for both Math AND Reading • FOR THIS REASON AYP DATA WHICH ARE BROKEN UP BY CONTENT AREA ARE USELESS WITHOUT AN OVERALL NUMBER • Proper Calculation on following page
Indicator 3A - AYP • Example calculation – State XYZ has had 32 districts meet AYP for Math, and 28 districts meet AYP for Reading • ONLY 14 districts made AYP for BOTH Math and Reading • State XYZ had 50 districts meet the minimum “N” size • Calculation = districts meet AYP / total “N” districts • = 14 / 50 • = 28% overall • NOTICE – THIS NUMBER IS SMALLER THAN THE MATH OR READING CONTENT AREA ONLY CALCULATION
Indicator 3B - Participation • This number is intended to show the percentage of students with IEPs in your state that are participating in statewide assessments • The intent is to be able to measure by accommodation or alternate assessment • In order for full analysis to be possible data should be provided for each grade level and content area tested • Also each sub-indicator should have data provided (3B(b), 3B(c), etc.) • Proper Calculation on following page
Indicator 3B - Participation • Calculations: • A. # of children with IEPs in assessed grades; • B. # of children with IEPs in regular assessment with no accommodations • C. # of children with IEPs in regular assessment with accommodations • D. # of children with IEPs in alternate assessment against grade level achievement standards • E. # of children with IEPs in alternate assessment against alternate achievement standards • Account for any children included in “A” but not included in “B, C, D, or E” above.
Indicator 3B - Participation • Proper formatting for tables (one each content area): • A table for raw #’s and one for percentages works best
Indicator 3B - Participation • Example % calculation – State XYZ had 1,000 students with IEPs at the 4th grade level for reading • Of these, 900 took the regular assessment • 400 of these used accommodations • Calculation = # on regular assessment with accommodations / total IEP students • = 400 / 1,000 • = 40% participation • NOTE – The remaining 500 would account for 50% of the overall population who took the regular assessment without accommodations
Indicator 3C - Performance • This number is intended to show the percentage of students with IEPs in your state that are PROFICIENT in statewide assessments • The intent is to be able to measure by accommodation or alternate assessment • In order for full analysis to be possible data should be provided for each grade level and content area tested • Also each sub-indicator should have data provided (3B(b), 3B(c), etc.) • Proper Calculation on following page
Indicator 3C - Performance • Calculations: • A. # of children with IEPs in assessed grades; • B. # of children with IEPs proficient or above in regular assessment with no accommodations • C. # of children with IEPs proficient or above in regular assessment with accommodations • D. # of children with IEPs proficient or above in alternate assessment against grade level achievement standards • E. # of children with IEPs proficient or above in alternate assessment against alternate achievement standards • REMEMBER – Raw numbers are VITAL!!!
Indicator 3C - Performance • Proper formatting for tables (one each content area): A table for raw #’s and one for percentages works best
Indicator 3C - Performance • Example % calculation – State XYZ had 1,000 students with IEPs at the 4th grade level for reading • Of these, 400 took the regular assessment with accommodations • 300 of these scored proficient or above • Calculation = # on regular assessment with accommodations / total IEP students • = 300 / 1,000 • = 30% proficient • NOTE – Similar calculations should take place for non-accommodated regular assessments and alternate assessments
Indicator 3 vs. Table 6 – the connection • Much of the data included in indicator 3 can also be found with Section 618: Table 6 – which must be included with all APR submissions. • This included ALL participation information • However, remember – SAMPLING is not allowed • For example – - APR Indicator 3B(a) for a given grade level should be equal to column 1 data in Table 6 - APR Indicator 3B(d) for a given grade level should be equal to column 4a data in Table 6
Indicator 3 vs. Table 6 • Use the below table when lifting data from Table 6 for Indicator 3 • Note that there is no transfer possible from columns 9A to Data Points C(b) and C(c). Table 6 does not ask for proficiency information for the regular assessment by accommodation status
NCEO Data Viewer • Check your states policy and assessment performance using the NCEO Data Viewer, an interactive data Web site available online at http://data.nceo.info/. • It contains information on: • State policies on assessment participation and accommodations • State Annual Performance Report (APR) data (taken from Table 6) • Users can create customizable reports (color-coded maps and tabular charts) based on chosen criteria. • The Data Viewer also provides a Tutorial, Glossary of Terms, and links to related NCEO Publications. • Coming soon to the site will be more prefabricated Special Analyses and other unique reports.
NCEO Data Viewer • Here is an example of a policy report:
NCEO Data Viewer • Here is another example of a policy report:
NCEO Data Viewer • The map below shows the percent of high school students proficient on the regular assessment in each state for 2003-04. :
Questions; Comments • Jason Altman, altma014@umn.edu • Chris Bremer, breme006@umn.edu • Christopher Rogers, roge0229@umn.edu • NCEO “online”, www.nceo.info • NCEO Data Viewer, data.nceo.info