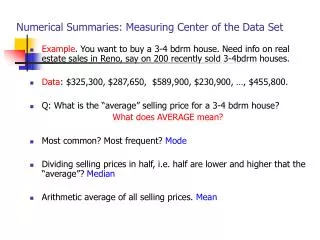
Numerical summaries for quantitative data
Numerical summaries for quantitative data. Module I3 Sessions 4 and 5. Learning objectives. Students should be able to: Explain why it is important to summarise the variability of a dataset Provide from first principles and explain

Numerical summaries for quantitative data
E N D
Presentation Transcript
Numerical summaries for quantitative data Module I3 Sessions 4 and 5
Learning objectives • Students should be able to: • Explain why it is important to summarise • the variability of a dataset • Provide from first principles and explain • the role of the common summary statistics for average and spread for a simple dataset • Visualise a dataset to estimate • the standard deviation from a graph of the data • Visualise a dataset to construct • a histogram or boxplot, given a numerical summary • Explain the formulae • for the variance, standard deviation and mean deviation
Contents Activity 1: Power point presentation • To stress the importance of understanding summary statistics. Activity 2: Practical 1 • Calculate averages and measures of variation Activity 3: Practical 2 • Interpret and explain averages and measures of variation Activity 4: Review of key points and concepts
Why variation is SO important • From D. S. Moore • In Statistics: A Guide to the Unknown – 4th Edition • “Variation is everywhere • Individuals vary. • Repeated measurements on the same individual vary. • The science of statistics • provides tools for dealing with variation” • Give examples of the two statements in blue: • time of arrival at a lecture, • blood pressure, • reaction times, • penalty taking in football.
Look at the wide range of situations! • Record some examples on the board or flip chart. • How many people said the same thing? • How many areas of application can be considered?
CAST and summary statistics CAST will be used extensively in one of the practicals
DFID and climate – was this area mentioned? Reducing the vulnerability of the poor to current climate variability is the starting point for adaptation to climate change. Climatic variability is a fundamental driver of poverty in poor countries. The climate is changing and it is highly likely that it will worsen poverty and hinder efforts to achieve the Millennium Development Goals. The poor cannot cope with current climatic variation in many parts of the world, but this issue is often ignored in poverty assessments or national development planning. Responses to existing climatic variability should be mainstreamed into national development plans and processes. Current responses by individuals and governments to the impacts of climate variability can be used as the basis for adaptation to the increasing climatevariabilitythat will be associated with longer-term climate change.
So • To practice statistics • You must be able to summarise sets of data • Including giving a measure of “average” • And particularly to summarise the variability • The simple summaries of variability are easy • The extremes (maximum and minimum) and the range • The quartiles • But the most used measure of variation • Is called the standard deviation • You can calculate it easily – in Excel!!! • But you must understand and be able to interpret it • And that is what you need to learn from these sessions
Activity 2: Practical 1 • Trivial data sets • By hand – for understanding • And using Excel • To explain the formulae • So you can also use them • Including the coefficient of variation (cv) • Which provides a good initial test of your understanding • The cv is useful, but also overused • We ask you to explain when it should NOT be used
Activity 3: Using CAST for help • You work in pairs • Learning from CAST • and then taking on a teacher’s role • You need to understand a topic well • To be able to explain it to someone else • CAST also gives exercises • To estimate the variability from a histogram or boxplot • To draw the histogram or boxplot, given the summary values • You also try these tasks • With your partner to help – or hinder!
Discussion • From practical 1: • Suppose marks in a test are • 12, 15, … so the mean = 20 and the s.d. = 8 • Students are all given 15 marks bonus for attending • They all attended, so all get the extra 15 • What is the mean and what is the standard deviation?
A possible problem with Excel • Software should give the right answer • We show that Excel standard functions did not • though SSC-Stat is OK • Give the mean and standard deviation of: 1 2 3 4 5 mean = 3 s.d. = 1.58 • What is the mean and s.d. if we add 10? 11 12 13 14 15 mean = ??? s.d. = ???
A possible problem with Excel • Software should give the right answer • We show that Excel standard functions did not • though SSC-Stat is OK • Give the mean and standard deviation of: 1 2 3 4 5 mean = 3 s.d. = 1.58 • What is the mean and s.d. if we add 10? 11 12 13 14 15 mean = 13 s.d. = 1.58 again • Check you are absolutely clear that this is true • And if you add 100 the s.d. = ??? • And if you add 1000 the s.d. = ???
Standard deviation in Excel 2000 Same as previous slide ooops!
This problem with Excel • It was fixed in Excel 2003 • But it should make you worry • that other answers might still be wrong • We return to this point in Session 13 • Now the key idea is your understanding of the measures of variation
The coefficient of variation – (cv) • It is popular in some areas of application • And easy to misuse • It is given by • cv = 100 * s.d./mean • When should it NOT be used • When the s.d. should not be used. When is that? • When it is not sensible to divide by the mean. When is that?
Training – how did it go? • Did you get good marks as trainers? • What suggestions did you have for improvements?
My reasoning was as follows: In the figure, everything is between 100 and 300 Most data (not quite all) are within 2 * s.d., so s.d. must be less than 50. So I said 45!
Learning objectives • Are you now able to: • Explain why it is important to summarise • the variability of a dataset • Provide from first principles and explain • the role of the common summary statistics for average and spread for a simple dataset • Visualise a dataset to estimate • the standard deviation from a graph of the data • Visualise a dataset to construct • a histogram or boxplot, given a numerical summary • Explain the formulae • for the variance, standard deviation and mean deviation
Now you know about the common summary statistics, the next sessions put them to use