Unlocking the Power of Information Visualization in Finance: Insights by Ruud Smeulders
In this presentation, Innovation Manager Ruud Smeulders from Rabobank Group explores the essential role of information and data visualization in today's data-driven world. Covering practical applications such as marketing and investment data visualization, Smeulders discusses the significance of perception, Gestalt principles, and human pattern recognition. He highlights the challenges of managing vast volumes of data and the importance of effective visual design to enhance decision-making. This engaging session emphasizes the future potential of data visualization in both financial and scientific contexts.

Unlocking the Power of Information Visualization in Finance: Insights by Ruud Smeulders
E N D
Presentation Transcript
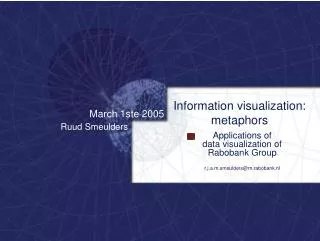
Information visualization: metaphors March 1ste 2005 Ruud Smeulders Applications of data visualization of Rabobank Group r.j.a.m.smeulders@rn.rabobank.nl
allow me to introduce … • dr ir R.J.A.M. (Ruud) Smeulders r.j.a.m.smeulders@rn.rabobank.nl • Innovation Manager Technology Rabobank Group (Rabobank, Interpolis, Robeco, Alex, De Lage Landen) • Responsible for several projects on information- and data visualization for Rabobank and Robeco Group
overview college • Introduction • Why information & data visualization? • Visualization of marketing data • Visualization of investment stocks • Data visualization for management
Introduction: Information Design (CH4 Rosson & Carroll) UI design • More realism • More perception • More interaction Perception: sensors • Eye, ear, touch, smell, taste, balance • Ultra violet, infra red, ultra sound,… Gulf of Evaluation • Perception • Interpretation • Making sense Gulf of Execution • System goal • Action plan • Execution
Perception: Gestalt Principles & optical illusions Gestalt Principles • Proximity • Similarity • Closure • Area • Symmetry • Continuity Optical Illusions
3d representation • Size • Interposition • Contrast, clarity & brightness • Shadow • Texture • Motion parallax
why information visualization? • Amount of data is growing quickly • Computing all data with (new) software is not possible (software development is too slow) • Information visualization has proven it’s value for scientific visualization • But visualization of abstract data collections is almost unknown Figure above: data explosion according to IBM Figure left: Gentechnology: ribosome + RNA + protine Figure right: Cafeïne tunnel
Possibilities with data visualization • Overview of large amounts of data • Many variables can be visualized together • Human eye and brain are perfect to view patterns and disparities: ideal data mining tool
Examples from the financial world Figure above left: stock data Figure under left: SmartMoney MarketMap Figure above right: navigation tool with skier Figure under right: location results company
Visualization of marketing data • Marketing data from accounting system • Experiments with selection of 25.000 customers • Interactive 3d correlation matrix for sorting and selecting • 3d cube with custom properties in spheres and colors
Visualization of emerging market fund • Emerging market fund VEGAS • In several countries with stocks from different companies • Landscape • Evolve to abstract landscape
Data visualization for management support • Strategy 2005+ • From 350 150 local banks • Results policy • Variables on the map of Holland Delft Xn Eindhoven Xm
Conclusions • Information visualization is complex due to perception and 3d representation problems • Data visualization can handle large amounts of data • Much possibilities (scientific and en financial visualizations) for data mining, text mining, analyses, variables in GIS • Still in early stage of life cycle of technology • A lot of work to be done to design optimal UI for 3d data visualization