Download
1 / 1
10 likes | 133 Vues
Clustering and Geography: Analysis of HIV Transmission among UK MSM. Lucy Weinert* 1 , Gareth Hughes 1 , Esther Fearnhill 2 , David Dunn 2 , Andrew Rambaut 1 , Andrew Leigh-Brown 1 on behalf of the UK HIV Drug Resistance Collaboration. * lucy.weinert@ed.ac.uk

E N D
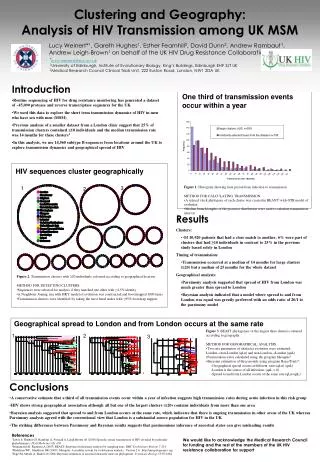
Clustering and Geography: Analysis of HIV Transmission among UK MSM Lucy Weinert*1, Gareth Hughes1, Esther Fearnhill2, David Dunn2, Andrew Rambaut1, Andrew Leigh-Brown1on behalf of the UK HIV Drug Resistance Collaboration *lucy.weinert@ed.ac.uk 1University of Edinburgh, Institute of Evolutionary Biology, King’s Buildings, Edinburgh EH9 3JT UK 2Medical Research Council Clinical Trials Unit, 222 Euston Road, London, NW1 2DA UK • Introduction • Routine sequencing of HIV for drug resistance monitoring has generated a dataset of ~45,000 protease and reverse transcriptase sequences for the UK • We used this data to explore the short term transmission dynamics of HIV in men who have sex with men (MSM) • Previous analysis of a smaller dataset from a London clinic suggest that 25% of transmission clusters contained ≥10 individuals and the median transmission rate was 14 months for these clusters1 • In this analysis, we use 14,560 subtype B sequences from locations around the UK to explore transmission dynamics and geographical spread of HIV One third of transmission events occur within a year HIV sequences cluster geographically 1 3 • Figure 1. Histogram showing time period from infection to transmission • METHOD FOR CALCULATING TRANSMISSION: • A relaxed clock phylogeny of each cluster was created in BEAST2 with GTR model of evolution • Median branch lengths of the posterior distribution were used to calculate transmission interval 2 • Results • Clusters: • Of 10,920 patients that had a close match to another, 6% were part of clusters that had ≥10 individuals in contrast to 25% in the previous study based solely in London • Timing of transmission: • Transmission occurred at a median of 14 months for large clusters (≥20) but a median of 25 months for the whole dataset • Geographical analysis: • Parsimony analysis suggested that spread of HIV from London was much greater than spread to London • Bayesian analysis indicated that a model where spread to and from London was equal was greatly preferred with an odds ratio of 20/1 to the parsimony model • Figure 2. Transmission clusters with ≥20 individuals coloured according to geographical location • METHOD FOR DETECTING CLUSTERS: • Sequences were selected for analysis if they matched one other with ≥4.5% identity • A Neighbour Joining tree with HKY model of evolution was constructed and bootstrapped 1000 times • Transmission clusters were identified by taking the most basal nodes with ≥95% bootstrap support Geographical spread to London and from London occurs at the same rate • Figure 3. BEAST phylogenies of the largest three clusters coloured according to geography • METHOD FOR GEOGRAPHICAL ANALYSIS: • Two rate parameters of character evolution were estimated: London→non-London (qLn) and non-London→London (qnL) • Parsimonious rates calculated using the program Mesquite3 • Bayesian estimation of three models using program BayesTraits4: • -Geographical spread occurs at different rates (qLn) (qnL) • -London is the source of all infections (qnL = 0) • -Spread to and from London occurs at the same rate (qLn=qnL) 1 2 3 • Conclusions • A conservative estimate that a third of all transmission events occur within a year of infection suggests high transmission rates during acute infection in this risk group • HIV shows strong geographical association although all but one of the largest clusters (≥20) contains individuals from more than one area • Bayesian analysis suggested that spread to and from London occurs at the same rate, which indicates that there is ongoing transmission in other areas of the UKwhereas Parsimony analysis agreed with the conventional view that London is a substantial source population for HIV in the UK • The striking differences between Parsimony and Bayesian results suggests that parsimonious inference of ancestral states can give misleading results References 1Lewis F, Hughes GJ, Rambaut A, Pozniak A, Leigh Brown AJ (2008) Episodic sexual transmission of HIV revealed by molecular phylodynamics. PLoS Medicine 5(3): e50 2Drummond AJ, Rambaut A (2007) BEAST: Bayesian evolutionary analysis by sampling trees. BMC Evolutionary Biology 7:214 3Maddison WP, Maddison DR (2009) Mesquite: A modular system for evolutionary analysis. Version 2.6. http://mesquiteproject.org 4Pagel M, Meade A, Barker D (2004) Bayesian estimation of ancestral character states on phylogenies. Systematic Biology 53:673-684 We would like to acknowledge the Medical Research Council for funding and the rest of the members of the UK HIV resistance collaboration for support