Central Tendency and Variability
Central Tendency and Variability. Sample Homework Problem Solving the Problem with SPSS Logic for Central Tendency and Variability Problems. Homework problems: Central tendency and variability.

Central Tendency and Variability
E N D
Presentation Transcript
Central Tendency and Variability Sample Homework Problem Solving the Problem with SPSS Logic for Central Tendency and Variability Problems
Homework problems: Central tendency and variability The following is a description of the demographic characteristics of the subset of survey respondents who thought it should be possible for a woman to obtain a legal abortion if the woman's own health is seriously endangered by the pregnancy in the data set "GSS2000R.Sav". The variable "attitude toward abortion when a woman's health seriously endangered" [abhlth] was used to identify the sample, and the demographic characteristics reported are the variables "age" [age], "highest academic degree" [degree], "sex" [sex] and "income" [rincom98]. The data for this study consisted of the subset of survey respondents who thought it should be possible for a woman to obtain a legal abortion if the woman's own health is seriously endangered by the pregnancy (n = 164). Of the 270 cases in the dataset, 86 were omitted because of missing data and 20 cases were in other categories of the variable "attitude toward abortion when a woman's health seriously endangered" [abhlth]. The average age was 45.8. Approximately two-thirds of the survey respondents had an age between 28.2 and 63.3. Survey respondents who had graduated from high school made up the largest category for highest academic degree (53.4%). Most of the survey respondents were female (53.7%). The median income was $22,500 - 24,999. Approximately half of the survey respondents had an income between $12,500 - 14,999 and $40,000 - 49,999. • True • False • Inappropriate use of a statistic This is the general framework for the problems in the homework assignment on central tendency and variability. The measures of central tendency and variability are used in the description of the sample similar to what might appear in a research article.
Homework problems: Data set, variables, and sample The following is a description of the demographic characteristics of the subset of survey respondents who thought it should be possible for a woman to obtain a legal abortion if the woman's own health is seriously endangered by the pregnancy in the data set "GSS2000R.Sav". The variable "attitude toward abortion when a woman's health seriously endangered" [abhlth] was used to identify the sample, and the demographic characteristics reported are the variables "age" [age], "highest academic degree" [degree], "sex" [sex] and "income" [rincom98]. The data for this study consisted of the subset of survey respondents who thought it should be possible for a woman to obtain a legal abortion if the woman's own health is seriously endangered by the pregnancy (n = 164). Of the 270 cases in the dataset, 86 were omitted because of missing data and 20 cases were in other categories of the variable "attitude toward abortion when a woman's health seriously endangered" [abhlth]. The average age was 45.8. Approximately two-thirds of the survey respondents had an age between 28.2 and 63.3. Survey respondents who had graduated from high school made up the largest category for highest academic degree (53.4%). Most of the survey respondents were female (53.7%). The median income was $22,500 - 24,999. Approximately half of the survey respondents had an income between $12,500 - 14,999 and $40,000 - 49,999. • True • False • Inappropriate use of a statistic • The first paragraph identifies: • The data set to use, e.g. GSS2000R.Sav • The subset of cases to include in the analysis • The variable to use to create the subset • The variables used as the demographic descriptors of the sample
Homework problems: Sample size The following is a description of the demographic characteristics of the subset of survey respondents who thought it should be possible for a woman to obtain a legal abortion if the woman's own health is seriously endangered by the pregnancy in the data set "GSS2000R.Sav". The variable "attitude toward abortion when a woman's health seriously endangered" [abhlth] was used to identify the sample, and the demographic characteristics reported are the variables "age" [age], "highest academic degree" [degree], "sex" [sex] and "income" [rincom98]. The data for this study consisted of the subset of survey respondents who thought it should be possible for a woman to obtain a legal abortion if the woman's own health is seriously endangered by the pregnancy (n = 164). Of the 270 cases in the dataset, 86 were omitted because of missing data and 20 cases were in other categories of the variable "attitude toward abortion when a woman's health seriously endangered" [abhlth]. The average age was 45.8. Approximately two-thirds of the survey respondents had an age between 28.2 and 63.3. Survey respondents who had graduated from high school made up the largest category for highest academic degree (53.4%). Most of the survey respondents were female (53.7%). The median income was $22,500 - 24,999. Approximately half of the survey respondents had an income between $12,500 - 14,999 and $40,000 - 49,999. • True • False • Inappropriate use of a statistic • The second paragraph describes: • the number of cases in the data set, • the number of cases with missing data, and • the number of cases with valid data that will be included in the analysis. • The answer to the problem can only be true if all of the numbers describing the sample are correct.
Homework problems: Statistical description of variables The remaining paragraphs describe each demographic characteristic in terms of central tendency and variability. These paragraphs are written in the descriptive format similar to what would appear in a journal, rather than as lists of statistical values. This will require you to translate the SPSS output, variable, and value labels to more descriptive statements. The following is a description of the demographic characteristics of the subset of survey respondents who thought it should be possible for a woman to obtain a legal abortion if the woman's own health is seriously endangered by the pregnancy in the data set "GSS2000R.Sav". The variable "attitude toward abortion when a woman's health seriously endangered" [abhlth] was used to identify the sample, and the demographic characteristics reported are the variables "age" [age], "highest academic degree" [degree], "sex" [sex] and "income" [rincom98]. The data for this study consisted of the subset of survey respondents who thought it should be possible for a woman to obtain a legal abortion if the woman's own health is seriously endangered by the pregnancy (n = 164). Of the 270 cases in the dataset, 86 were omitted because of missing data and 20 cases were in other categories of the variable "attitude toward abortion when a woman's health seriously endangered" [abhlth]. The average age was 45.8. Approximately two-thirds of the survey respondents had an age between 28.2 and 63.3. Survey respondents who had graduated from high school made up the largest category for highest academic degree (53.4%). Most of the survey respondents were female (53.7%). The median income was $22,500 - 24,999. Approximately half of the survey respondents had an income between $12,500 - 14,999 and $40,000 - 49,999. • True • False • Inappropriate use of a statistic
Homework problems: Description of interval variables An interval level variable that is not skewed, e.g. age, will be correctly described by its mean and the interval representing one standard deviation on either side of the mean according to the empirical rule. If an interval level variable is badly skewed, it should be described by the median and the lower and upper bounds of the interquartile range, just as we would describe an ordinal level variable. The following is a description of the demographic characteristics of the subset of survey respondents who thought it should be possible for a woman to obtain a legal abortion if the woman's own health is seriously endangered by the pregnancy in the data set "GSS2000R.Sav". The variable "attitude toward abortion when a woman's health seriously endangered" [abhlth] was used to identify the sample, and the demographic characteristics reported are the variables "age" [age], "highest academic degree" [degree], "sex" [sex] and "income" [rincom98]. The data for this study consisted of the subset of survey respondents who thought it should be possible for a woman to obtain a legal abortion if the woman's own health is seriously endangered by the pregnancy (n = 164). Of the 270 cases in the dataset, 86 were omitted because of missing data and 20 cases were in other categories of the variable "attitude toward abortion when a woman's health seriously endangered" [abhlth]. The average age was 45.8. Approximately two-thirds of the survey respondents had an age between 28.2 and 63.3. Survey respondents who had graduated from high school made up the largest category for highest academic degree (53.4%). Most of the survey respondents were female (53.7%). The median income was $22,500 - 24,999. Approximately half of the survey respondents had an income between $12,500 - 14,999 and $40,000 - 49,999. • True • False • Inappropriate use of a statistic The skewness of the distribution of an interval level variable will be acceptable if it is greater than -1, but less than +1. If the skewness statistic falls outside this range, the variable is badly skewed.
Homework problems: Description of ordinal variables The following is a description of the demographic characteristics of the subset of survey respondents who thought it should be possible for a woman to obtain a legal abortion if the woman's own health is seriously endangered by the pregnancy in the data set "GSS2000R.Sav". The variable "attitude toward abortion when a woman's health seriously endangered" [abhlth] was used to identify the sample, and the demographic characteristics reported are the variables "age" [age], "highest academic degree" [degree], "sex" [sex] and "income" [rincom98]. The data for this study consisted of the subset of survey respondents who thought it should be possible for a woman to obtain a legal abortion if the woman's own health is seriously endangered by the pregnancy (n = 164). Of the 270 cases in the dataset, 86 were omitted because of missing data and 20 cases were in other categories of the variable "attitude toward abortion when a woman's health seriously endangered" [abhlth]. The average age was 45.8. Approximately two-thirds of the survey respondents had an age between 28.2 and 63.3. Survey respondents who had graduated from high school made up the largest category for highest academic degree (53.4%). Most of the survey respondents were female (53.7%). The median income was $22,500 - 24,999. Approximately half of the survey respondents had an income between $12,500 - 14,999 and $40,000 - 49,999. • True • False • Inappropriate use of a statistic An ordinal level variable, e.g. income, is described by the median and the upper and lower bounds of the interquartile range, which contains the middle 50% or half of the cases. If an ordinal variable has value labels, the test of the value label will be reported in the problem statement ($22,500 - 24,999, $12,500 - 14,999, and $40,000 - 49,999) rather than the numeric codes for the categories (14, 10, and 18).
Homework problems: Description of ordinal variables The following is a description of the demographic characteristics of the subset of survey respondents who thought it should be possible for a woman to obtain a legal abortion if the woman's own health is seriously endangered by the pregnancy in the data set "GSS2000R.Sav". The variable "attitude toward abortion when a woman's health seriously endangered" [abhlth] was used to identify the sample, and the demographic characteristics reported are the variables "age" [age], "highest academic degree" [degree], "sex" [sex] and "income" [rincom98]. The data for this study consisted of the subset of survey respondents who thought it should be possible for a woman to obtain a legal abortion if the woman's own health is seriously endangered by the pregnancy (n = 164). Of the 270 cases in the dataset, 86 were omitted because of missing data and 20 cases were in other categories of the variable "attitude toward abortion when a woman's health seriously endangered" [abhlth]. The average age was 45.8. Approximately two-thirds of the survey respondents had an age between 28.2 and 63.3. Survey respondents who had graduated from high school made up the largest category for highest academic degree (53.4%). Most of the survey respondents were female (53.7%). The median income was $22,500 - 24,999. Approximately half of the survey respondents had an income between $12,500 - 14,999 and $40,000 - 49,999. • True • False • Inappropriate use of a statistic “Highest academic degree” is also an ordinal variable, but it contains an excessive number of tied scores which compromise the meaning of the median and interquartile range. When a variable has excessive ties, its mode andthe percent of cases in the modal category is reported. The value label is used instead of the numeric code. An ordinal variable will be considered to have excessive tie scores when the median has the same value as either the lower or upper bound of the interquartile range. When that occurs, it essentially implies that the measure of central tendency and variability are the same.
Homework problems: Description of nominal variables The following is a description of the demographic characteristics of the subset of survey respondents who thought it should be possible for a woman to obtain a legal abortion if the woman's own health is seriously endangered by the pregnancy in the data set "GSS2000R.Sav". The variable "attitude toward abortion when a woman's health seriously endangered" [abhlth] was used to identify the sample, and the demographic characteristics reported are the variables "age" [age], "highest academic degree" [degree], "sex" [sex] and "income" [rincom98]. The data for this study consisted of the subset of survey respondents who thought it should be possible for a woman to obtain a legal abortion if the woman's own health is seriously endangered by the pregnancy (n = 164). Of the 270 cases in the dataset, 86 were omitted because of missing data and 20 cases were in other categories of the variable "attitude toward abortion when a woman's health seriously endangered" [abhlth]. The average age was 45.8. Approximately two-thirds of the survey respondents had an age between 28.2 and 63.3. Survey respondents who had graduated from high school made up the largest category for highest academic degree (53.4%). Most of the survey respondents were female (53.7%). The median income was $22,500 - 24,999. Approximately half of the survey respondents had an income between $12,500 - 14,999 and $40,000 - 49,999. • True • False • Inappropriate use of a statistic Nominal (including dichotomous) variables, e.g. sex, are described by their mode andthe percent of cases in the modal category. The value label is used instead of the numeric code.
Homework problems: Choosing an answer The answer to a problem will be True if all of the statements about the sample size, and the measures of central tendency are correct, both in terms of the statistic selected and the value reported. The following is a description of the demographic characteristics of the subset of survey respondents who thought it should be possible for a woman to obtain a legal abortion if the woman's own health is seriously endangered by the pregnancy in the data set "GSS2000R.Sav". The variable "attitude toward abortion when a woman's health seriously endangered" [abhlth] was used to identify the sample, and the demographic characteristics reported are the variables "age" [age], "highest academic degree" [degree], "sex" [sex] and "income" [rincom98]. The data for this study consisted of the subset of survey respondents who thought it should be possible for a woman to obtain a legal abortion if the woman's own health is seriously endangered by the pregnancy (n = 164). Of the 270 cases in the dataset, 86 were omitted because of missing data and 20 cases were in other categories of the variable "attitude toward abortion when a woman's health seriously endangered" [abhlth]. The average age was 45.8. Approximately two-thirds of the survey respondents had an age between 28.2 and 63.3. Survey respondents who had graduated from high school made up the largest category for highest academic degree (53.4%). Most of the survey respondents were female (53.7%). The median income was $22,500 - 24,999. Approximately half of the survey respondents had an income between $12,500 - 14,999 and $40,000 - 49,999. • True • False • Inappropriate use of a statistic The answer to a problem will be False if a wrong value is reported for the sample size or for a statistic, or the wrong statistic is reported but the level of measurement criteria are not violated. • The answer to a problem will Inappropriate use of a statistic if the reported statistic violates the level of measurement criteria, i.e.: • the mean and standard deviation are reported for an ordinal or nominal variable • the median and interquartile range are reported for a nominal variable.
Solving the problem with SPSS: Checking the number of cases - 1 Our first task is to use a frequency distribution to verify the number of cases available for the analysis to check the statement in the problem that: The data for this study consisted of the subset of survey respondents who thought it should be possible for a woman to obtain a legal abortion if the woman's own health is seriously endangered by the pregnancy (n = 164). Of the 270 cases in the dataset, 86 were omitted because of missing data and 20 cases were in other categories of the variable "attitude toward abortion when a woman's health seriously endangered" [abhlth]. Select the Descriptive Statistics > Frequencies… command from the Analysis menu.
Solving the problem with SPSS: Checking the number of cases - 2 Since all we want is the frequency distribution, we click on the OK button to generate the output. In the Frequencies dialog box, we move the variable used to define the subset, abhlth, to the Variable(s): listbox.
Solving the problem with SPSS: Checking the number of cases - 3 The problem stated: “The data for this study consisted of the subset of survey respondents who thought it should be possible for a woman to obtain a legal abortion if the woman's own health is seriously endangered by the pregnancy (n = 164). Of the 270 cases in the dataset, 86 were omitted because of missing data and 20 cases were in other categories of the variable "attitude toward abortion when a woman's health seriously endangered" [abhlth]..” As we can see in the frequency table, each of these numbers is correct.
Solving the problem with SPSS: Selecting the subset - 1 Our next task in SPSS is to select the subset cases that will be used in the analysis. The problem statement tell us that the sample for this problem is: “the subset of survey respondents who thought it should be possible for a woman to obtain a legal abortion if the woman's own health is seriously endangered by the pregnancy.” It identifies the variable used to select the sample [abhlth]. Our first task is to find the data value for abhlth which represents respondents who agreed with the statement that women should be able to get an abortion when their health is in danger. We go to the Variable View in the SPSS Data Editor and locate the variable.
Solving the problem with SPSS: Selecting the subset - 2 We scroll to the right until we see the Values column. When we click on the cell for abhlth in the values column, a button with an elipsis on it appears. Click on this button to open the Values Label dialog box. Click on OK to close the dialog box. The Values Labels dialog box shows us the text labels that the creator of the data set assigned to each of the possible numeric responses for this variable. 1 = “YES” would be the logical choice to indicate that respondents agreed that women should be able to get an abortion for health reasons. This analysis will include cases who have a score of 1 for the variable abhlth.
Solving the problem with SPSS: Selecting the subset - 3 To select the subset of cases for this analysis, we retun to the Data View of the SPSS Data Editor and we choose the Select Cases… command from the Data menu.
Solving the problem with SPSS: Selecting the subset - 4 In the Select Cases dialog box, we mark the option button If condition is satisifed, and click on the If… button which becomes active when the option button is marked.
Solving the problem with SPSS: Selecting the subset - 5 Second, we click on the right arrow button to move the variable to the text box where we will compose our selection criteria. First, we highlight the variable we want to use, abhlth, in selecting the subset.
Solving the problem with SPSS: Selecting the subset - 6 First, we complete the selection criteria by typing the value for the cases we want to include, = 1. Second, we click on the Continue button to close the Select Cases: If dialog box.
Solving the problem with SPSS: Selecting the subset - 7 When we return to the Select Cases dialog, we see that SPSS has printed our selection criteria next to the If… button. Click on the OK button to complete the selection of the subset.
Solving the problem with SPSS: Selecting the subset - 8 When we return to the Data Editor, we scroll the variables to the right until we see the column for abhlth. We see that SPSS has marked out the cases that will be excluded by drawing a diagonal slash through the row number. The cases that are excluded have either a “0” for “No” answers or a “.” which indicates missing data. The cases with a value of “1” for abhlth do not have the slash and will be included in the analysis.
Solving the problem with SPSS: Generating the output - 1 We will use the Frequencies procedure to generate the frequency distribution and the measures of central tendency and variability that we need to evaluate the statements about the individual demographic variables. Select the Descriptive Statistics > Frequencies… command from the Analysis menu. • The frequencies procedure will give us the output we need to solve the remainder of the problem: • Measures of central tendency and variability, and • A frequency distribution to get the percent in the modal category.
Solving the problem with SPSS: Generating the output - 2 • In the Frequencies dialog box, we first move the variables that we need for the description of our sample to the Variables(s): list box: • age • degree • sex • rincom98 Second, we click on the Statistics… button to select the statistics we need.
Solving the problem with SPSS: Generating the output - 3 • We mark the check boxes for the measures of central tendency: • Mean, • Median, and • Mode. We mark the check box for Quartiles. SPSS does not compute the interquartile range in Frequencies, but we can easily get it with the values of the first and third quartile. When we have marked all of the check boxes, we click on the Continue button to close the dialog. • We mark the check boxes for the measures of variability: • Std. deviation, • Variance, • Range, • Minimum, and • Maximum. We mark the check box for Skewness so we can determine whether to use the mean or the median for an interval variable.
Solving the problem with SPSS: Generating the output - 4 Having selected the statistics we want, we click on the OK button to generate the output. Do not clear the check box to Display frequency tables. We will need the frequency table for the percent of cases in the modal category.
Solving the problem with SPSS: Statistical description of age - 1 The descriptive statement for the variable age stated: “The average age was 45.8. Approximately two-thirds of the survey respondents had an age between 28.2 and 63.3.” Age is an interval level variable with a skewness value of 0.697, less than the +1.0 rule of thumb for severe skewing. We use the mean and standard deviation to describe the distribution of the variable.
Solving the problem with SPSS: Statistical description of age - 2 The descriptive statement for the variable age stated: “The average age was 45.8. Approximately two-thirds of the survey respondents had an age between 28.2 and 63.3.” The mean for age is 45.77, which rounds to 45.8. The average is correctly stated. Using the empirical rule, 2/3 (68%) of cases have a score within 1 standard deviation of the mean. The mean – 1 standard deviation = 45.77 – 17.524 = 28. 2. The mean + 1 standard deviation = 45.77 + 17.524 = 63.3. The statement on variability is correct.
Solving the problem with SPSS: Statistical description - academic degree - 1 The descriptive statement for the variable highest academic degree stated: “Survey respondents who had graduated from high school made up the largest category for highest academic degree (53.4%).” Highest academic degree [degree] is an ordinal variable, so we would expect to report the median and interquartile range. However, the median and the lower bound of the interquartile range (25th percentile) both have a value of 1.00, indicating a problem with tied scores. We report the mode instead of the median.
Solving the problem with SPSS: Statistical description - academic degree - 2 The descriptive statement for the variable highest academic degree stated: “Survey respondents who had graduated from high school made up the largest category for highest academic degree (53.4%)..” The mode is also 1, which corresponds to the category “HIGH SCHOOL” in the value labels. To verify the percent in the modal category, we look at the frequency distribution.
Solving the problem with SPSS: Statistical description - academic degree - 3 The descriptive statement for the variable highest academic degree stated: “Survey respondents who had graduated from high school made up the largest category for highest academic degree (53.4%)..” The Valid Percent for the category “1 HIGH SCHOOL” is 53.4%. The statement that high school graduates made up the largest category at 53.4% is correct.
Solving the problem with SPSS: Statistical description of gender - 1 The descriptive statement for the variable gender is stated: Most of the survey respondents were female (53.7%). Sex is a dichotomous variable (a nominal variable with 2 categories), so the appropriate measure of central tendency to report is the mode. The mode for sex is 2. We look at the frequency distribution to obtain the label for the category 2 and the percentage of cases in the modal category.
Solving the problem with SPSS: Statistical description of gender - 2 The descriptive statement for the variable gender is stated: Most of the survey respondents were female (53.7%). In the Valid Percent column for the row “2 FEMALE” is 53.7, as stated in the problem. The statement about gender is correct. In the frequency table, we see that the numeric value of 2 is associated with the FEMALE category.
Solving the problem with SPSS: Statistical description of income - 1 The descriptive statement for the variable highest academic degree stated: “The median income was $22,500 - 24,999. Approximately half of the survey respondents had an income between $12,500 - 14,999 and $40,000 - 49,999.” Income [rincom98] is an ordinal variable, so we would expect to report the median and interquartile range. The median is 14.00. The lower bound of the interquartile range is 10.0. The upper bound of the interquartile range is 18.0. Both the upper and lower bounds of the interquartile range differ from the median, so there is no issue of excessive ties.
Solving the problem with SPSS: Statistical description of income - 2 The descriptive statement for the variable highest academic degree stated: “The median income was $22,500 - 24,999. Approximately half of the survey respondents had an income between $12,500 - 14,999 and $40,000 - 49,999.” In the Value Labels, the median value of 14 corresponds to $22,500 - 24,999. The values for the interquartile range, 10 to 18, correspond to $12,500 - 14,999 and $40,000 - 49,999. Since this statement, as well as all of the others are correct, the answer to the question is true.
Restoring all of the cases to the dataset - 1 We have selected a specific subset of cases for this problem. To make sure we do not use the wrong subset for the next problem, we will restore all of the cases to the data set. Click on the Select Cases… command from the Data menu.
Restoring all of the cases to the dataset - 2 Click on the All cases option button to remove the If condition. Click on the OK button to complete the command.
Restoring all of the cases to the dataset - 3 The slashes through the case numbers are removed, indicating that all of the cases are available to the next command.
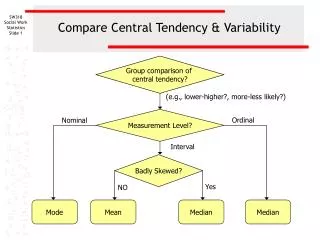
Yes Logic for homework problems: Central tendency and variability- 1 Number of valid and missing cases correct? No False Measurement level of variable? Ordinal Nominal (dichotomous) Interval
Skewed? Median/ IQR reported? Mean/ St.Dev. reported? No False False Correct value? Correct value? No Yes Yes Yes No Yes Yes No No False False True True Logic for homework problems: Central tendency and variability- 2 Interval/ratio A variable is skewed if its skewness is not between -1.0 and + 1.0. Mode reported? Mode is legitimate for interval variables, but not meaningful unless values are grouped. Homework problems do not include modes for interval variables.
Yes Yes Yes No Yes Yes Logic for homework problems: Central tendency and variability- 3 Excessive ties occur when the median is equal to either the lower or upper bound of the IQR. Ordinal Mean/ St.Dev. reported? Excessive ties? No Yes Median/ IQR reported? Mode reported? Inappropriate application of a statistic No False False Correct value? Correct value? No No False False True True
Correct value? No True False Yes Yes Yes Yes Logic for homework problems: Central tendency and variability- 4 Nominal (dichotomous) Median/ IQR reported? Mode reported? Mean/ St.Dev. reported? No No Inappropriate application of a statistic Inappropriate application of a statistic