Download
1 / 44
440 likes | 592 Vues
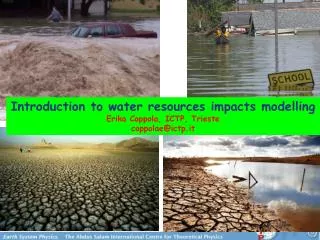
Introduction to water resources impacts modelling Erika Coppola, ICTP, Trieste coppolae@ictp.it. Impact modelling : Vulnerability and adaptation with respect to water resources Hydrologic implications of climate change for water resources Focus of the school

E N D
Introduction to water resources impacts modelling Erika Coppola, ICTP, Trieste coppolae@ictp.it
Impact modelling: Vulnerability and adaptation with respect to water resources • Hydrologic implications of climate change for water resources • Focus of the school • Uncertainty in a Climate Change scenario
Defining V&A assessment • Often V&A is analysis, not assessment • Why? Because the focus is on biophysical impacts, e.g., hydrologic response, crop yields, forests, etc. • However, assessment is an integrating process requiring the interface of physical and social science and public policy
Examples of Adaptation – Water Supply • Construction/modification of physical infrastructure • Canal linings • Closed conduits instead of open channels • Integrating separate reservoirs into a single system • Reservoirs/mydroplants/delivery systems • Raising dam wall height • Increasing canal size • Removing sediment from reservoirs for more storage • Interbasin water transfers
Examples of Adaptation – Water Supply(continued) • Adaptive management of existing water supply systems • Change operating rules • Use conjunctive surface/groundwater supply • Physically integrate reservoir operation system • Coordinate supply/demand
Examples of Adaptation – Water Supply (continued) • Policy, conservation, efficiency, and technology • Domestic • Municipal and in-home re-use • Leak repair • Rainwater collection for nonpotable uses • Low flow appliances • Dual supply systems (potable and nonpotable) • Agricultural • Irrigation timing and efficiency • Lining of canals, closed conduits • Drainage re-use, use of wastewater effluent • High value/low water use crops • Drip, micro-spray, low-energy, precision application irrigation systems • Salt-tolerant crops that can use drain water
Examples of Adaptation – Water Supply (continued) • Policy, conservation, efficiency, and technology (continued) • Industrial • Water re-use and recycling • Closed cycle and/or air cooling • More efficient hydropower turbines • Cooling ponds, wet towers and dry towers • Energy (hydropower) • Reservoir re-operation • Cogeneration (beneficial use of waste heat) • Additional reservoirs and hydropower stations • Low head run of the river hydropower • Market/price-driven transfers to other activities • Using water price to shift water use between sectors
Tools in Water Resource V&A Studies • Hydrologic models (physical processes) • Simulate river basin hydrologic processes • Examples – water balance, rainfall-runoff, lake simulation, stream water quality models • Water resource models (physical and management) • Simulate current and future supply/demand of system • Operating rules and policies • Environmental impacts • Hydroelectric production • Decision support systems (DSS) for policy interaction • Economic models
Studying the Hydrologic Cycle at Various Scales Evapotranspiration Sublimation Evaporation Snow Accumulation Mountain Front Recharge Precipitation Discharge Snowmelt Runoff Surface Runoff Surface Runoff Infiltration Discharge Groundwater flow Recharge Globally: 86% of Evap. and 78% of Precip. occur over the oceans
Source: SorooshSorooshian Center for Hydrometeorology and Remote Sensing University of California Irvine
Two Primary Water Resources/Hydrology Challenges: • Hydrologic Hazards ( Floods and Droughts) • Water Supply Requirements ( Quantity and Quality)
“General” and Widespread Floods August 14, 1993 Illinois River Mississippi River Missouri River August 19, 1993 Bangladesh floods in 2004 MISSISSIPPI Floods 1993 Source: SorooshSorooshian Center for Hydrometeorology and Remote Sensing University of California Irvine
Drought most visible in falling reservoir levels Normal Years Recent Southwest Drought 2004 Lake Powell, Colorado River, USA Source: J. Kane SRP 2004
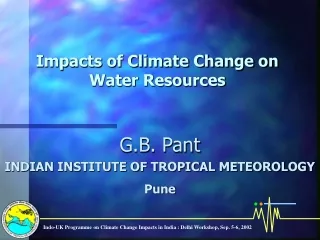
Climate Change and Hydrologic Implications • Precipitation amount • Global average increase • Marked regional differences • Precipitation frequency and intensity • Less frequent, more intense (Giorgi et al., 2011;Trenberth et al., 2003) • Evaporation and transpiration • Increase total evaporation
Climate Change and Hydrologic Implications (continued) • Changes in runoff • Despite global precipitation increases, areas of substantial runoff decrease • Coastal zones • Saltwater intrusion into coastal aquifers • Severe storm-surge flooding • Water quality • Lower flows could lead to higher contaminant concentrations • Higher flows could lead to greater leaching and sediment transport
Global Warming And Hydrologic Cycle Connection Heating Temperature Evaporation Atmospheric Moisture Water Holding Capacity Saturated Vapor Pressure Drought Flood t+20 t Rain Intensity Green House Effect Temperature oF Drought Flood Created by: Gi-Hyeon Park
How Extreme Can it Get ????? The Recent Drought in Historical Context: Reconstruction of Proxy records: - Analysis of Tree Rings and Stable Isotopes
Reconstructed PDSI Great Drought Late 16th cent Megadrought Highly variable Past Present Future Recent US Southwest Drought in Historical Context Sept 1951 Elephant Butte, NM Jan 2003 Grissino-Mayer, Baisan, Morino, & Swetnam, 2001 Middle Rio Grande Basin, NM AD
Two Primary Water Resources/Hydrology Challenges: • Hydrologic Hazards ( Floods and Droughts) • Water Supply Requirements ( Quantity and Quality)
Projected Regions of Water Stress Source: SorooshSorooshian Center for Hydrometeorology and Remote Sensing University of California Irvine
467.34 460 380 4.0% 3.0% 7.0% 6.0% 41.7% 45.2% 93.0% 87.0% 13.1% Iran 117 23.0% 70.3 Agriculture 36.47 60.0% 17.0% 18.6% Domestic 59.4% 22.0% 92% 6% 2% Industry Distribution of Fresh Water Use Water Source USA China India Fresh Water Use (109 Cubic Meters) Water Use Russia Japan Brazil 90.8 33.4% 49.5% 17.1% Source: SorooshSorooshian Center for Hydrometeorology and Remote Sensing University of California Irvine
80% 71% 70% 60% 52% 50% 40% 36% 33% 30% 29% Projected Population Increase 2000-2025 26% 30% 17% 20% 10% -4% 0% Asia World -10% Europe Oceania North America South America Sub-Saharan Africa Middle East & North Africa Central America & Caribbean Projected Population Growth Distribution 1995 world population 5.7 Billion 2025 Projection 8.3 Billion Source: SorooshSorooshian Center for Hydrometeorology and Remote Sensing University of California Irvine
Our projections of future water use have been flawed. 14000 12000 Projections 10000 8000 Cubic Kilometers per Year 6000 Actual Global Water Withdrawals 4000 2000 0 1900 1910 1920 1930 1940 1950 1960 1970 1980 1990 2000 2010 2020 2030 2040 2050 SOURCE: Dr. Peter H. Gleick, Pacific Institute for Studies in Development
Rapid Change in Global Demographics Source: United Nations, 1996
Population Without Access to Improved Water Supply: 2000 Total: 1,100 million SOURCE: Dr. Peter H. Gleick, Pacific Institute for Studies in Development
Hydrology Model • Critical questions • How does rainfall on a catchment translate into flow in a river? • What pathways does water follow as it moves through a catchment? • How does movement along these pathways impact the magnitude, timing, duration, and frequency of river flows?
Data Requirements • Prescribed supply (riverflow given as fixed time series) • Time series data of riverflows (headflows) cfs • River network (connectivity) • Alternative supply via physical hydrology (watersheds generate riverflow) • Watershed attributes • Area, land cover . . . • Climate • Precipitation, temperature, windspeed, and relative humidity
Data Requirements(continued) • Water demand data • Municipal and industrial demand • Aggregated by sector (manufacturing, tourism, etc.) • Disaggregated by population (e.g., use/capita, use/socioeconomic group) • Agricultural demands • Aggregated by area (# hectares, annual water-use/hectare) • Disaggregated by crop water requirements • Ecosystem demands (in-stream flow requirements)
Calibration and Validation • Model evaluation criteria • Flows along mainstream and tributaries • Reservoir storage and release • Water diversions from other basins • Agricultural water demand and delivery • Municipal and industrial water demands and deliveries • Groundwater storage trends and levels
Uncertainty in climate change impact assessment in water resources • Global climate models (GCMs) use different but plausible parameterisations to represent the climate system. • Sometimes due to sub-grid scale processes (<250km) or limited understanding.
Uncertainty in climate change impact assessment • Therefore climate projections differ by institution: 2°C
Multiple ensembles for various prescribed temperature changes Simon Gosling, Walker Institute for Climate System Research, University of Reading 9 model runs Global Average Annual Runoff
The ensemble mean Global Average Annual Runoff Change from Present (%) But what degree of uncertainty is there?
Uncertainty in simulations Number of models in agreement of an increase in runoff
Catchment-scale Seasonal Runoff The Yangtze The Liard The Okavango
Seasonal Runoff Agreement of increased snow-melt induced runoff Large uncertainty throughout the year Less certainty regarding wet-season changes Agreement of dry-season becoming drier
What can we do to decrease the uncertanty • Further downscaling: Regional climate modelling • Bias correction techniques • ENSEMBLE approach: • Dynamical downscaling • Statistical downscaling VALUE European COST project
Ensuring Water in a Changing World Source: SorooshSorooshian Center for Hydrometeorology and Remote Sensing University of California Irvine International Water Cycle Research Initiatives Addressing These Issues: - WCRP (GEWEX, CLIVAR, CLiC)- UNESCO Initiatives (PUB, HELP)- And Many National Programs
Water Resources Applications Coupled Ocean-Atmosphere Models Mesoscale Models E Hydrologic/Routing Models P Qs D Ss Qg D Sg Ig SVATs GEWEX Role in Climate Research Water resources management agencies CLiC CLIVAR Monsoon Processes GEWEX Hydrologic Services Source: SorooshSorooshian Center for Hydrometeorology and Remote Sensing University of California Irvine
DATA MODEL PARAMETER ESTIMATION Requirements and State of Hydrologic Forecasting If the “World” of Watershed Hydrology Was Perfect! Source: SorooshSorooshian Center for Hydrometeorology and Remote Sensing University of California Irvine