Operations Management Inventory Management Chapter 12
Operations Management Inventory Management Chapter 12. Outline. GLOBAL COMPANY PROFILE: AMAZON.COM FUNCTIONS OF INVENTORY Types of Inventory INVENTORY MANAGEMENT ABC Analysis Record Accuracy Cycle Counting Control of Service Inventories . Outline - Continued. INVENTORY MODELS

Operations Management Inventory Management Chapter 12
E N D
Presentation Transcript
Outline • GLOBAL COMPANY PROFILE: AMAZON.COM • FUNCTIONS OF INVENTORY • Types of Inventory • INVENTORY MANAGEMENT • ABC Analysis • Record Accuracy • Cycle Counting • Control of Service Inventories
Outline - Continued • INVENTORY MODELS • Independent versus Dependent Demand • Holding, Ordering, and Setup Costs • INVENTORY MODELS FOR INDEPENDENT DEMAND • Basic Economic Order Quantity (EOQ) Model • Minimizing Costs • Reorder Points • Production Order Quantity Model • Quantity Discount Models
Outline - Continued • PROBABILISTIC MODELS WITH CONSTANT LEAD TIME • FIXED PERIOD (P) SYSTEMS
Learning Objectives When you complete this chapter, you should be able to : Identify or Define: • ABC analysis • Record accuracy • Cycle counting • Independent and dependent demand • Holding, Ordering, and Setup Costs Describe or Explain: • The functions of inventory and basic inventory models
AMAZON.com • Jeff Bezos, in 1995, started AMAZON.com as a “virtual” retailer – no inventory, no warehouses, no overhead; just a bunch of computers. • Growth forced AMAZON.com to excel in inventory management! • AMAZON is now a worldwide leader in warehouse management and automation.
Order Fulfillment at AMAZON • You order items;, computer assigns your order to distribution center [closest facility that has the product(s)] • Lights indicate products ordered to workers who retrieve product and reset light. • Items placed in crate with items from other orders, and crate is placed on conveyor. Bar code on item is scanned 15 times – virtually eliminating error.
Order Fulfillment at AMAZON- Continued • Crates arrive at central point where items are boxed and labeled with new bar code. • Gift wrapping done by hand (30 packages per hour) • Box is packed, taped, weighed and labeled before leaving warehouse in a truck. • Order appears on your doorstep within a week
What is Inventory? • Stock of materials • Stored capacity • Examples © 1995 Corel Corp. © 1984-1994 T/Maker Co. © 1984-1994 T/Maker Co. © 1995 Corel Corp.
The Functions of Inventory • To ”decouple” or separate various parts of the production process • To provide a stock of goods that will provide a “selection” for customers • To take advantage of quantity discounts • To hedge against inflation and upward price changes
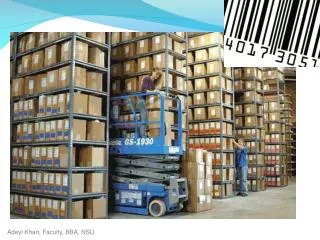
Types of Inventory • Raw material • Work-in-progress • Maintenance/repair/operating supply • Finished goods
The Material Flow Cycle Note the proportion of time material spends as inventory as opposed to being actually worked on. Effective inventory management and materials movement can reduce overall cycle time significantly!
Disadvantages of Inventory • Higher costs • Item cost (if purchased) • Ordering (or setup) cost • Costs of forms, clerks’ wages etc. • Holding (or carrying) cost • Building lease, insurance, taxes etc. • Difficult to control • Hides production problems
ABC Analysis • Divides on-hand inventory into 3 classes • A class, B class, C class • Basis is usually annual $ volume • $ volume = Annual demand x Unit cost • Policies based on ABC analysis • Develop class A suppliers more • Give tighter physical control of A items • Forecast A items more carefully
% Annual $ Usage Class % $ Vol % Items A 80 15 100 B 15 30 80 C 5 55 60 A 40 B C 20 0 0 50 100 Classifying Items as ABC % of Inventory Items
Cycle Counting • Physically counting a sample of total inventory on a regular basis • Used often with ABC classification • A items counted most often (e.g., daily)
Advantages of Cycle Counting • Eliminates shutdown and interruption of production necessary for annual physical inventories • Eliminates annual inventory adjustments • Provides trained personnel to audit the accuracy of inventory • Allows the cause of errors to be identified and remedial action to be taken • Maintains accurate inventory records
Why do we control inventory? • Inventories represent a vast segment of total economic activity. • Even minor improvements can create large savings. How do we control inventory? • Application of optimization techniques • Information processing and retrieval techniques
Decisions of an inventory policy • If there is no production, i.e., pure inventory system • How much to order? Order quantity • When to order? Reorder quantity Ex:Order Q=100 units when the inventory level drops to ROP=15 units. • If there is also production • When to start/stop production?
Elements of Inventory Decisions • Costs: • Ordering and Procurement costs (or Setup costs in manufacturing systems) • Inventory holding or carrying costs • Inventory shortage costs • Demand structure • How does it vary? Certain, uncertain? • Supply structure • Any capacity limitations, defectives, number of suppliers? • Lead times: • Certain, uncertain?
Ordering and Procurement Costs • Represent all expenses incurred in ordering or manufacturing items related to • Acquisition • Transportation • Collecting, sorting, placing the items in the storage • Managerial and clerical costs associated with order placement. • Ordering costs are fixed, independent of the order size. • Supplies • Forms • Order processing • Clerical support • Procurement costsdepend on the order size.
Set-up Costs In a manufacturing system order costs are realized in the form of “set-up” costs. These include: • Clean-up costs • Re-tooling costs • Adjustment costs
Inventory Holding or Carrying Costs • Expenses incurred during the storage of items. • Physical Costs: Warehouse operation costs, insurence, property taxes. • Pilferage, spoilage, obsolescence • Opportunity cost of investing in inventory rather than investing somewhere else, ex. in a bank. • Inventory costs are variable costs that depend on the order size.
Category Housing costs (building rent, depreciation, operating cost, taxes, insurance) Material handling costs (equipment, lease or depreciation, power, operating cost) Labor cost from extra handling Investment costs (borrowing costs, taxes, and insurance on inventory) Pilferage, scrap, and obsolescence Overall carrying cost Cost as a % of Inventory Value 6% (3 - 10%) 3% (1 - 3.5%) 3% (3 -5%) 11% (6 - 24%) 3% (2 - 5%) 26% Inventory Holding Costs(Approximate Ranges)
Shortage Costs • Occur whenever the demand is not satisfied. Order is either “backordered” or “lost”. • Backordering Costs: • Fixed cost of extra managerial work. • Loss of customer goodwill: Variable cost that depends on duration of backorder. • Lost Sales Costs: • Marginal profit that the item would have earned. • Loss of customer goodwill.
Demand Structure • Continuous versus discrete demand Ex: Natural gas consumption in houses Detergent consumption in houses • Deterministic (certain) versus stochastic (uncertain) demand Ex: Order quantities for the next months are 20,30,10,50. Order quantities in a month are normally distributed with mean 25 and variance 4. • Constant versus dynamic demand Ex: Demand quantities for the next months are 20, 21, 20, 19 Demand quantities for the next months are 20, 50, 10, 2
Supply Structure • Any defectives? If the received lot includes defective items this brings uncertainty • Any capacity limitations? Do we fully receive what we order? • Number of suppliers, fixed or variable?
Lead time • Time elapsed between the order delivery and order receipt. • Can be constant or stochastic. Ex: Lead time is 10 days. Lead time is between 8-12 days.
Inventory Models Help answer the inventory planning questions! • Fixed order-quantity models • Economic order quantity • Production order quantity • Quantity discount • Probabilistic models • Fixed order-period models © 1984-1994 T/Maker Co.
The Economic Order QuantityEOQ-Model • Decision variable:Q = Order Quantity • Parameters: S = Fixed cost per order ($/order) D = Annual number of items demanded (unit/year) P= Unit cost of procuring an item ($/unit) I= Annual cost of holding a dollar in inventory ($/$/year) H= Annual cost of holding a unit item in inventory ($/unit/year) H=IP • Objective is to “minimize total annual cost”.
EOQ Inventory Policy Average Inv. Level
Assumptions of Classical EOQ Model • Demand rate is constant or stable. • There is infinite supply availability. • Lead time is constant or zero. • No quantity discounts are made. • All demand is met on time, no backordering, no stockout. • Only order (or setup) cost and holding cost
Annual Cost Total Cost Curve Holding Cost Curve Minimum total cost Order (Setup) Cost Curve Order quantity Optimal Order Quantity (Q*) EOQ ModelHow Much to Order?
Costs of EOQ Model • Total ordering cost is the number of orders times the cost per order: • Total holding cost is the cost per item held 1year times the average inventory: • The annual procurement cost is the product of annual demand and unit cost: Procurement cost = PD
Annual Cost of EOQ-Model • Here PDis not a relevant cost and thus dropped. • Minimize Total Annual Inventory Cost:
Optimal Solution of EOQ • Optimal solution is theeconomic order quantity • Optimal Total Cost
Example:The House of Wines and Liquors Allex Mullen decides that the first task in utilizing inventory models is to determine the value of model parameters: • Annual demand 5200 cases of beer • $10 telephone charge for ordering • Purchase cost is $1.5/case beer+shipping cost $0.5/case • 10%bank interest, 5%state franchise tax, 5% theft insurance rate How many should he order, how often, and at what annual relevant inventory cost?
Solution: The economic order quantity is • The inventory cycle duration is T = Q/D= 510/5200 = 0.098 year or 36 days • The total annual relevant inventory cost is:
Robustness of EOQ Model • EOQ is a robust model with respect to the estimation errors in D, S, P or I. • Let Dactual=4 Destimated Then EOQactual=2 Destimated Since
Ex: The House of Wines and Liquors • Alex Mullen applies EOQ to another product, a particular variety of Chilean wine that sells 1000 cases annually. The cost is $20 per case. A telephone call to Chile to place an order costs $100. The holding costs are the same as for Tres Equis Beer.
Ex: The House of Wines and Liquors T = Q/D= 24/1000 = .224 year or 82 days
Q* Slope = units/day = d Inventory level (units) ROP (Units) Time (days) Lead time = LT The Reorder Point ROPWhen to give orders? ROP=d*LT
Optimal Inventory Policywith Backordering Orders placed during shortages are backordered.
Optimal Inventory Policywith Backordering Imax: Quantity on hand when a shipment arrives. C:Cost of being one item short for a year Optimal order quantity and order level
Example:The House of Wines and Liquors-Backorders The marketing department tells Alex that beer is a convenience product that can not be backordered, so sale is lost! However some wine customers are connoisseurs who are willing to order out-of-stock items. Nevertheless, the store owner will incur some penalty cost if there is a shortage of wine. Suppose that retailer suffers lost profit on future business equal to $0.01/unit each day that a wine is on backorder. What should be the optimal ordering policy if backordering is allowed? Solution: The order quantity is computed: p = $.01×365 = $3.65/unit/year.
Example: Solution • The max. order level Imax is • The relevant cost is smaller than before, why?
Is backordering better? • Fewer orders are placed when there is backordering. • Average inventory level is smaller. Backorders/cycle=Q* – Imax* =324 – 154 = 170 units/cycle. Proportion of demand not satisfied on time =(Q*- Imax* )/Q*=170/324= 52.5%Service level = 1- Proportion of demand not satisfied on time = 1-52.5%=47.5% • The results suggest that: Retailers will run short in each cycle. But can they get away with it? • So backordering must make sense!
Shortage Penalty Considerations Shortage Cost Shortage Cost C C Time Time 1 year 1 year Theoretical Assumption Case excluded by the model
Imputed Shortage Penalty An alternative approach for establishing an inventory policy is based on achieving a desired service level. Service Level, L is the proportion of demand met on time Imputed shortage penalty