Download
1 / 24
240 likes | 357 Vues
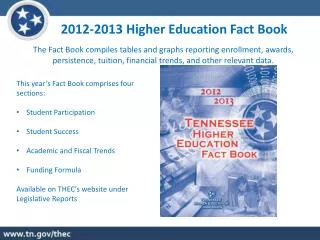
The 2012-2013 Higher Education Fact Book provides comprehensive data on enrollment, awards, persistence, and financial trends in Tennessee’s public postsecondary institutions. This Fact Book is structured into four sections: Student Participation, Student Success, Academic and Fiscal Trends, and Funding Formula. It highlights significant statistics including fall enrollment totals, retention rates, and tuition trends over time. For more detailed insights, access the full document on THEC’s website under Legislative Reports, or contact Kimberly Martin for inquiries.

E N D
2012-2013 Higher Education Fact Book The Fact Book compiles tables and graphs reporting enrollment, awards, persistence, tuition, financial trends, and other relevant data. • This year’s Fact Book comprises four sections: • Student Participation • Student Success • Academic and Fiscal Trends • Funding Formula • Available on THEC’s website under Legislative Reports
2012 Fall Enrollment Total 2012 Tennessee Fall Enrollment 400,908
Fall Headcount by System/Sector Fall Total HC 2010 406,755 2011 407,599 2012 400,908
Public Postsecondary Fall Enrollment Trends Recession Ends June 2009 Recession Begins Dec 2007
Fall Public Enrollment: 1979-2012 1973-75 Stagflation
Fall Public Enrollment: 1979-2012 1973-75 Stagflation
Fall Public Enrollment: 1979-2012 1973-75 Stagflation
Current and Projected Number of High School Graduates Source: Western Interstate Commission on Higher Education, “Knocking at the College Door”
Current and Projected Number of High School Graduates Source: Western Interstate Commission on Higher Education, “Knocking at the College Door”
Fall Public First-Time Freshmen Enrollment
Postsecondary Enrollment of Recent Tennessee High School Graduates Source: IPEDS, Residence and Migration Survey; THEC, Profiles and Trends Report
Share of Recent High School Grads Staying In-State Source: IPEDS, Residence and Migration Survey; THEC, Profiles and Trends Report
Retention Rates First-Time, Full-Time Freshmen Entering During the Fall and Returning the Following Fall
Six-Year Graduation Rates First-Time, Full-Time Freshmen Cohorts
Average Undergraduate Annual Tuition and Mandatory Fees by Institution Type
Average Undergraduate Annual Tuition at 4yr Institutions: Adjusted for Inflation 10 year percent change – 112% Percent change adjusted for inflation – 66%
Average Debt for 2010-2011 TN Public University Graduates Source: Institute for College Access & Success, “The Project on Student Debt.”
www.tn.gov/thec/Legislative/Reports.html Please contact Kimberly Martin with any questions. Kimberly.D.Martin@tn.gov (615) 532-6613