Real-World Applications of Big Data Analytics with Graph and Time Series Analysis by Christos Faloutsos
Dive into the realm of big data analytics as applied by Christos Faloutsos, exploring anomaly detection, time series analysis, and fraud detection. Learn from his research in network effects tools and cutting-edge technologies for real-world data mining applications.

Real-World Applications of Big Data Analytics with Graph and Time Series Analysis by Christos Faloutsos
E N D
Presentation Transcript
Big (graph) data analytics Christos Faloutsos CMU
Outline • Problem definition / Motivation • Anomaly detection • Time series analysis • Conclusions C. Faloutsos
Motivation • Data mining: ~ find patterns (rules, outliers) • How do real graphs look like? Anomalies? • Time series / Monitoring Measles @ PA, NY, … C. Faloutsos
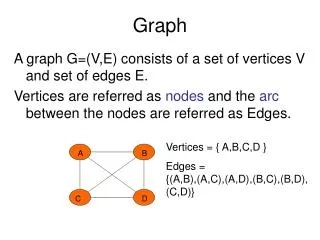
Graphs - why should we care? C. Faloutsos
Graphs - why should we care? Food Web [Martinez ’91] ~1B users $10-$100B revenue Internet Map [lumeta.com] C. Faloutsos
Outline • Problem definition / Motivation • Anomaly/fraud detection • Financial fraud • Ebay fraud • Time Series Analysis • Conclusions C. Faloutsos
Network Effect Tools: SNARE • Some accounts are sort-of-suspicious – how to combine weak signals? Before C. Faloutsos
Network Effect Tools: SNARE • A: Belief Propagation. Before C. Faloutsos
Network Effect Tools: SNARE • A: Belief Propagation. Before After Mary McGlohon, Stephen Bay, Markus G. Anderle, David M. Steier, Christos Faloutsos: SNARE: a link analytic system for graph labeling and risk detection. KDD 2009: 1265-1274 C. Faloutsos
Network Effect Tools: SNARE • Produces improvement over simply using flags • Up to 6.5 lift • Improvement especially for low false positive rate Results for accounts data (ROC Curve) Ideal SNARE Baseline (flags only) True positive rate C. Faloutsos False positive rate
Network Effect Tools: SNARE • Accurate- Produces large improvement over simply using flags • Flexible- Can be applied to other domains • Scalable- One iteration BP runs in linear time (# edges) • Robust- Works on large range of parameters C. Faloutsos
Outline • Problem definition / Motivation • Anomaly/fraud detection • Financial fraud • Ebay fraud • Time series analysis • Conclusions C. Faloutsos
E-bay Fraud detection Detects ‘non-delivery’ fraud: seller takes $$ and disappears Shashank Pandit, Duen Horng Chau, Samuel Wang, and Christos Faloutsos. NetProbe: A Fast and Scalable System for Fraud Detection in Online Auction Networks WWW 07. C. Faloutsos
E-bay Fraud detection - NetProbe C. Faloutsos
‘Tycho’ – epidemics analysis Yasuko Matsubara 50 states x 46 diseases C. Faloutsos
‘Tycho’ – epidemics analysis Prof. Yasuko Matsubara C. Faloutsos
‘Tycho’ – epidemics analysis Prof. Yasuko Matsubara Flu? Measles? August? No periodicity? C. Faloutsos
‘Tycho’ – epidemics analysis Prof. Yasuko Matsubara Flu? Measles? August? No periodicity? C. Faloutsos
‘Tycho’ – epidemics analysis Prof. Yasuko Matsubara Flu? Measles? August? No periodicity? C. Faloutsos
‘Tycho’ – epidemics analysis Prof. Yasuko Matsubara Flu? Measles? August? No periodicity? C. Faloutsos
‘Tycho’ – epidemics analysis Prof. Yasuko Matsubara Flu? Measles? August? No periodicity? C. Faloutsos
‘Tycho’ – epidemics analysis Prof. Yasuko Matsubara https://www.tycho.pitt.edu/resources.php from U. Pitt (epidemiology dept.) Yasuko Matsubara, Yasushi Sakurai, Willem van Panhuis, and Christos Faloutsos, FUNNEL: Automatic Mining of Spatially Coevolving Epidemics, KDD 2014, New York City, NY, USA, Aug. 24-27, 2014. C. Faloutsos
Open research questions • Patterns/anomalies for time-evolving graphs (Call graph, 3M people x 6mo) • Spot fraudsters in soc-net (eg., Twitter ‘$10 -> 1000 followers’) C. Faloutsos
Contact info • www.cs.cmu.edu/~christos • GHC 8019 • Ph#: x8.1457 C. Faloutsos