Download
1 / 44
440 likes | 548 Vues
In 2006-2007, the Delaware Department of Transportation initiated the development of updated hurricane evacuation plans for Sussex, Kent, and New Castle Counties. The goal was to create a model to estimate evacuation durations based on behavioral, operational, and policy assumptions, particularly as evacuations could be complicated by congestion on key routes. Using Sussex County as a case study, the model integrated data on resident evacuation behaviors and traffic dynamics to enhance preparedness for potential large-scale storms. This analysis aimed to improve understanding and efficiency in statewide evacuation processes.

E N D
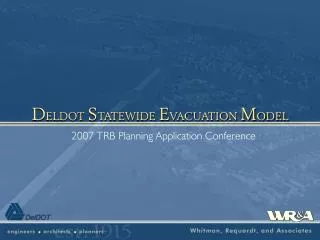
DELDOT STATEWIDE EVACUATION MODEL 2007 TRB Planning Application Conference
BACKGROUND In 2006 the Delaware Department of Transportation began updating hurricane evacuation plans for Sussex, Kent, and New Castle Counties. They wanted to develop estimates for the durations of evacuations within each of these counties.
BACKGROUND Need for Evacuation Planning • Delaware is located on the Delmarva Peninsula, situated between the Atlantic Ocean, Delaware Bay, and Chesapeake Bay • Their prime beach areas are located about 2 ½ hours from Washington, D.C. and Baltimore, MD
BACKGROUND Need for Evacuation Planning Two of the primary routes on and off of the Peninsula are bridges susceptible to congestion and closure during storm events. Photo by Scott Kozel
BACKGROUND Need for Evacuation Planning Fortunately, Delaware does not have much history of large-scale evacuations and not much documentation of how long it would take to evacuate.
Background Today we will use a Sussex County evacuation as a case study.
BACKGROUND Need for Evacuation Planning • Over 50% of the Sussex County Summer Population are not full-time residents • Sussex County has no multi-lane east-westroadways and nolimited-accesshighways
BACKGROUND The Delaware Department of Transportation set out to develop a model that would estimate the evacuation durations of different “what would happen if…” scenarios based on: • Behavioral Assumptions • Policy Decisions • Operational Assumptions
BACKGROUND – Behavioral Assumptions • At what pace do people evacuate? • How many people evacuate? • Where would people evacuate to?
BACKGROUND – Behavioral Assumptions At what pace to people evacuate?
BACKGROUND – Behavioral Assumptions How many people evacuate? A 2003 report by the US Army Corps of Engineers estimates that: • Between 45% and 80% of full-time residents would evacuate if ordered to • Between 90% and 95% of vacationers would evacuate if ordered to • Between 65% and 70% of the vehicles available to Evacuating Households would evacuate
BACKGROUND – Behavioral Assumptions Where do they evacuate to? Full-Time Residents • 20% stay in their neighborhood • 25% would evacuate within Sussex County • 25% would stay on the Delmarva Peninsula • 30% would evacuate off the Delmarva Peninsula Vacationers • 90% would return home
BACKGROUND – Behavioral Assumptions Where do they evacuate to? • 35% to Northern Delaware • 22% to Western Sussex County • 15% to Bay Bridge • 11% to I-95 West • 9% to I-95 East
BACKGROUND Policy Decisions • When should the evacuation be declared? • Should a “State of Emergency” be declared?
BACKGROUND Operational Assumptions Should the operational plan be implemented?
CHOOSING A MODEL Traditional Approaches • Spreadsheets • Regional Travel Demand Models • Simulation Models
CHOOSING A MODEL Spreadsheets • Benefits: • Easily explainable • Relatively easy to implement • Drawbacks: • Difficult to implement at a large scale • Difficult to account for specific operations plans • Difficult to estimate where evacuators go • Difficult to account for background congestion
CHOOSING A MODEL Regional Travel Demand Model • Benefits: • Readily available framework from DelDOT’s Statewide Model • Easy to implement statewide • Easy to account for background congestion • Drawbacks: • Difficult to account for spillover • Difficult to account for specific operations plans
CHOOSING A MODEL Simulation Model • Benefits: • Easy to account for specific operations plans • Easy to account for spillover • Drawbacks: • Difficult to implement statewide • Intensive calibration process • Must estimate trip table externally
MODEL DEVELOPMENT DelDOT chose to use their Statewide Travel Demand Model because of its geographic coverage and ease of implementation.
MODEL DEVELOPMENT DelDOT’s Peninsula Model • AADT and peak tourist season assignments • Encompasses Delaware + Maryland’s Eastern Shore (9 Counties) • Covers a population of 1,209,944 • Area of 5,375 miles2
MODEL DEVELOPMENT Evacuation Model • Capacity constrained model with hourly traffic assignments. • Accounts for the specific traffic control in place at intersections (signals, stop signs, roundabouts).
MODEL DEVELOPMENT Evacuation Model • 10 groups of “evacuation zones” and “destination zones” can be specified. • Specify evacuation start time • Model road closures during evacuation • Track spillover between hours • Input the pace of evacuation • Input the percentage of vehicles evacuated • Specify a “State of Emergency” for groups of zones
MODEL DEVELOPMENT Evacuation Model • Trip Generation • Background Assignment • Evacuation Trip Distribution • Evacuation Trip Assignment
MODEL DEVELOPMENT Trip Generation • Uses peak tourist season trip table from Peninsula Model • Determines background trip tables for 96 hours • Determines the number of vehicles in evacuating households (full-time and part-time) • Determines how many vehicles evacuate based on an input assumption (approximately 70% based on US Army Corps of Engineers)
MODEL DEVELOPMENT Background Traffic Assignment • Assigns non-evacuation trips to the network for 96 hours from the start of the evacuation. • Accounts for “State of Emergency” assumption.
MODEL DEVELOPMENT Evacuation Trip Distribution • Uses specified departure curves and specified evacuation and destination areas. • Uses doubly constrained logit distribution model to determine hourly evacuation trip tables for 30 hours of evacuation.
MODEL DEVELOPMENT – Evacuation Assignment Assign hourly evacuation trip tables to loaded hourly background traffic networks. • Check for Capacity Constraint. • Spill over-capacity trips to subsequent hours.
MODEL DEVELOPMENT – Evacuation Assignment Assign Hour 1 Evac. Trips Assign Hour 2 Evac. Trips to Spillover Network Determine Operating Capacity (Jam Density) Determine Operating Capacity (Jam Density) Check roads where volume exceeds Capacity Check roads where volume exceeds Capacity Excess Trips spillover to next hour Excess Trips spillover to next hour Assign Subsequent Hour Background trips to spillover network Assign Subsequent Hour Background trips to spillover network
Case Study 1 Parameters • 50% of non-evacuation traffic in Sussex County stays home • 70% of vehicles in Sussex County Beaches evacuate • Fast evacuation (all evacuees depart within 13 hours) • Operational Plan is Implemented • Evacuation is ordered at 6:00 AM • 8% of evacuees depart prior to the order, beginning at midnight
Case Study 2 Parameters Same as Case Study 1 except with Ocean City, MD evacuation
Case Study Results US 113 North of Georgetown SR 26 East of Dagsboro
Case Study 1 US 113 Northbound – North of Georgetown Evacuation Trips Exceed Capacity at 11:00 AM (12% Evacuating) Order at 6:00 AM (2% Evacuating) Majority of Evacuation Complete 4:00 PM (10% Evacuating) Evacuation Complete 7:00 PM
Case Study 2 US 113 Northbound – North of Georgetown Evacuation Trips Exceed Capacity at 6:00 AM (2% Evacuating) Majority of Evacuation Complete 4:00 PM (10% Evacuating) Order at 6:00 AM (2% Evacuating) Evacuation Complete 7:00 PM
Case Study 1 SR 26 Westbound – East of Dagsboro Evacuation Trips Exceed Capacity at Noon (12% Evacuating) Majority of Evacuation Complete 4:00 PM (10% Evacuating) Order at 6:00 AM (2% Evacuating) Evacuation Complete 7:00 PM
Case Study 2 SR 26 Westbound – East of Dagsboro Evacuation Trips Exceed Capacity at 8:00 AM (5% Evacuating) Majority of Evacuation Complete 4:00 PM (10% Evacuating) Order at 6:00 AM (2% Evacuating) Evacuation Complete 7:00 PM
Case Study 1 Evacuation Volumes by Time of Day Evacuation at 2:00 am (1%) Evacuation at 8:00 am (5%)
Case Study 2 Evacuation Volumes by Time of Day Evacuation at 2:00 am (1%) Evacuation at 8:00 am (5%)
Evacuation at Noon (12%) Evacuation at 5:00 pm (2%) Case Study 1 Evacuation Volumes by Time of Day
Evacuation at Noon (12%) Evacuation at 5:00 pm (2%) Case Study 2 Evacuation Volumes by Time of Day
Case Study Results • Case Study 1 Evacuation duration is 14 hours • Case Study 2 Evacuation duration is 21 hours
Conclusions • The model would be easily applied to any situation where capacity constrained traffic assignments would be beneficial (ex. Event Planning, Major Roadway Construction) • The model would be easily modified to estimate non-hurricane evacuations
Next Steps • Continue Working with DelDOT to Refine Evacuation Scenarios • Test Road and Bridge Closures Due to Storm Events • Continue to Improve Reporting Capabilities
Questions? Scott Thompson-Graves, PE, PTOE stg@wrallp.com Laura Rice, PE lrice@wrallp.com Mike DuRoss Michael.DuRoss@state.de.us