Download
1 / 11
110 likes | 264 Vues
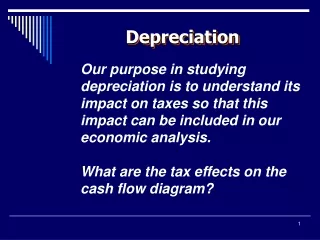
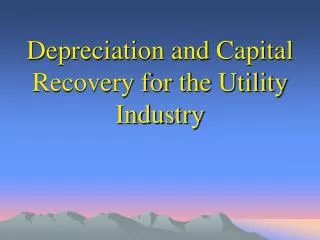
Depreciation and Capital Recovery for the Utility Industry. As ROR “analysts”, what do we know about depreciation?. It’s an operating expense. It’s part of the Revenue Requirement . RR = OM + T + d + [R × (V-D)]. RR = OM + T + d + [R × (V-D)]. OM = Operating & Maintenance costs T = Taxes

E N D
As ROR “analysts”, what do we know about depreciation? • It’s an operating expense. • It’s part of the Revenue Requirement. RR = OM + T + d + [R×(V-D)]
RR = OM + T + d + [R×(V-D)] OM = Operating & Maintenance costs T = Taxes d = Annual depreciation expense R = Rate of return V = Value of physical capital D = Accumulated depreciation R×(V-D) is called the “return portion” and V-D is called “rate base”
Revenue Requirement& Rate Regulation • Enables UTES to operate as near monopolies • Ceiling on price of service • Necessities by society • Capital-intensive • Long-lived facilities
Companies Reviewed, Period 2001-05 • UTES based on business lines • ~170 Cos. • Non-UTES based on S&P 1500 • Less UTE business lines ~1400 Cos.
Capital Intensive Ratio: Revenue / Gross Plant • UTES: $0.71 • Non-UTES: $5.23
Long Lived Ratio: Gross Plant / Depreciation Expense • UTES: 25yrs • Non-UTES: 12yrs • Telco 10yr • Elec 27yr • IPP 24yr • Gas S&T 28yr • Gas Dist 30yr • Water 52yr
Dep. Expense/Revenues UTES: 11.6% Non-UTES: 5.1% EBIT/Revenues UTES: 14.8% Non-UTES: 13.0% Ratio: Who’s Really Working NI/Revenues • UTES: 5.7% • Non-UTES: 6.2%
ROR & Depreciation Market Value of Firm • EBITDA Mult. • Market/Selected • Income Approach • EBITDA / Debt Free Net Cash Flow • Ratio: DA / EBITDA • UTES: 40.6% • Non-UTES 27.4%
ROR & Depreciation Credit Analysis • GCF / Interest Coverage • GCF / Average Total Debt • NCF / Construction • Ratio: DA / GCF • UTES: 52.5% • Non-UTES 34.6% CASH is King!
Nuts n Bolts of Depreciation • Depreciation and Capital Recovery for the Utility Industry • Donald J. Clayton, P.E., CFA, CDP