Download
1 / 17
180 likes | 365 Vues
Purchasing a car is a significant milestone for many Americans, often reflecting personal success. However, understanding the financial implications of such a purchase, especially depreciation, is crucial. Cars lose value over time, typically through both straight-line and exponential depreciation methods. For instance, a car purchased for $27,000 might lose a significant percentage of its value after just a few years. This text explores the factors affecting car costs, the nature of depreciation, and how to visualize this with scatterplots to reveal patterns in car sales and values.

E N D
Purchasing a Car • For many people in the United States, their car was a reflection on them. • People show the world how successful they are by the car they drive. • The United States is a large, spread out country. It was the first country to have a significant # of people living in suburbs, where a car became a necessity. • For many people getting a driver’s license and owning a car are milestones into adulthood and freedom from parents. • Americans spend millions on hydraulic shocks, shiny rims, car stereos and fuzzy dice. These items are not “useful”, they are fashion. • When buying a car it is important to understand both the benefits and the costs of that purchase.
Owning a Car Pros Cons Purchase price Car insurance Danger / Accidents Repairs Gas Parking • Look and feel cool • Get to work • Travel for fun • Save on bus/train fair
Costs of a Car • For many people a car is a necessity. • When purchasing a car be aware of the costs. • Original purchase price • Interest on loan • Insurance • Gas • Maintenance and Repair • Parking • Also keep in mind that a car loses its value quickly after purchase.
What is Depreciation? • “Depreciate” means to lose value over time. • Depreciation is the concept that most things become less valuable over time. • Most objects wear out or become obsolete the longer that we have them, so they lose value. • The longer you have owned something the less it is worth. • Accumulated Depreciation is the total amount of value the item has lost over time. • Current value = Purchase price – Accumulated depreciation • Accumulated depreciation = Purchase price – Current value
Financial and Accounting Depreciation • When companies buy equipment, the equipment is worth what they paid for it. They lose money, but they gain an asset of equal value, so they haven’t lost anything. There is no expense. • Over time as it loses its value, as it depreciates, companies can expense that depreciation. • The depreciation is equal to their expense. • That expense reduces their profit and therefore also reduces the taxes a company must pay. • We only “depreciate” items that we expect to last at least 2 years. • Rules for depreciation are set by accounting organizations and the IRS. They might not accurately reflect the actual value of the item being depreciated.
Car Depreciation Example • Suppose you purchase a car for $27,000. • On average cars of this make or model become worthless after about 12 years. • One can graph both the value and accumulated depreciation of the car by using the slope intercept formula. (This is known as straight line depreciation) y = mx + b m = (y2 – y1)/(x2 – x1) y = value x = time (years) m = slope (dep per year) b = initial cost of car • m = (27,000 - 0)/(0 – 12) = - 2,250 • y = -2,250x + 27,000 • If you have the original value and life, you can find the slope by simply dividing the original value by the life and making it negative. - ($27,000/12) = -2250 Asset Value = -Annual Depreciation x Age (in years) + Original Value
Car Depreciation Example • The equation y = -2,250x + 27,000 can be used to find the value of the car at any point in time. • After 5 years the car is worth -2,250 (5) + 27,000 = 15,750 Its accumulated depreciation is 11,250. • Accumulated Depreciation = original cost – current value • After 10 years the car is worth -2,250 (10) + 27,000 = 4,500 Its accumulated depreciation is 22,500.
Exponential Depreciation • When something depreciates by the same $ amount each year, it is known as straight line depreciation. • In reality, most items depreciate more at first and then depreciate more slowly after that. • It is said that a car loses 20% of its value as soon as you drive it off the lot. • Assuming a fixed % of depreciation is a more realistic method to depreciate an asset. • The exponential depreciation formula is… y = A(1-r)x y = value x = time (years) A = initial cost of car r = annual % depreciation as a decimal • Notice that this formula is exactly the same as compound interest formula except the rate is subtracted instead of added. (Appreciation vs Depreciation)
Exponential Depreciation Example • Suppose you buy a car for $27,000. • It depreciates 20% per year. • You can use the equation y = 27,000(1-.2)x to find the value of the car at any period in time. • After 5 years the car is worth 27,000(.8)5= 8,847 Its accumulated depreciation is 27,000 – 8,847 = 18,153. • After 10 years the car is worth 27,000(.8)10= 2,899 Its accumulated depreciation is 27,000 – 2,899 = 24,101.
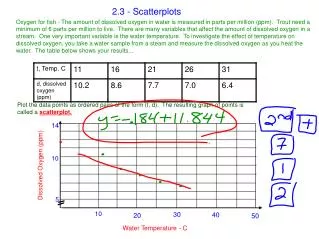
Scatterplots and Correlation • In real life data rarely lines up perfectly in straight lines or smooth curves. • Below is an example of used Honda sales prices
Correlation • Even though the points didn’t line up perfectly, there was a clear relationship between age and value. • This relationship is known as “Correlation” • Data might have a positive correlation, negative correlation or no correlation.
Lines of Best Fit • The data is scattered but there is a clear correlation • We can define the relationship better by defining a line of best fit
Steps to creating line of best fit. • Graph the scatterplot • Find a line through 2 coordinate points which roughly splits your data in half. • Find the slope between the points • Find the Y-intercept between the points • Write out the whole equation.
Line of Best Fit Example • The point on the bottom right is at (0,15). It also appears through coordinate (50,50).
Line of Best Fit Example • Use the point (0,15) and (50,50) to define line. • m = (y2-y1) / (x2 – x1) • m = (50-15) / (50 – 0) = 0.7 • The slope is 0.7, • For each % in homework, test scores are likely to increase 0.7% • Find the Y intercept, Y = mx + b • Pick either point to substitute for x and y • 15 = .7 (0) + b or 50 = .7 (50) + b • Either way b = 15 • The line of best fit is … y = .7x + 15