Understanding Scatterplots and Correlation: Key Definitions and Applications
This guide covers the fundamentals of scatterplots and correlation, emphasizing how closely data points fit a trend line. We explore concepts such as independent and dependent variables and their respective axes. The definition of continuous and discrete data sets is clarified with practical examples. Additionally, we'll discuss the line of best fit, its slope, and real-world applications, including determining equations and costs for given variables. Practical exercises are provided for hands-on learning.

Understanding Scatterplots and Correlation: Key Definitions and Applications
E N D
Presentation Transcript
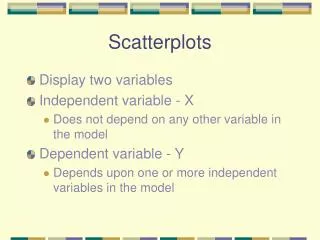
Key Definitions • Correlation: A measure of how closely the points on a scatterplot fit the line. Can be strong/weak, positive/negative. You are travelling at 100km/h. Time and Distance are the two variables. Distance travelled, d, depends on the time, t. In d = 100t, t is the independent variable and d is the dependent variable. Dependent is always plotted on the y axis and Independent on the x axis.
Key Definitions • Data set is Continuous if a variable can be any real number. Ex. volume of water vs. time under the tap. • Data set is Discrete if a variable cannot be any real number. Ex. Footballs sold in NS during the month of May.
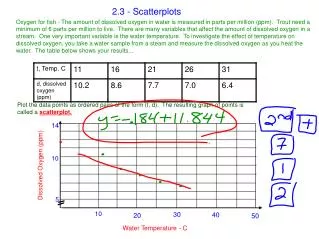
Application • Draw a line of best fit • Describe the relationship between volume of gasoline and amount paid • Is the data discrete or continuous? • Determine the equation of the line of best fit. What does the slope represent? • Using the equation, determine the cost of 10L of gas. Cost for 60L?
Linear or Non Linear Data? • Line of Best fit vs. Curve of Best Fit
Practice • Page 379 • #1 – 4 • Page 380 • #3, 10, 15, 17